
This, on Mike Sandford's suggestion, is the new arena for him and Mark to continue their fascinating discussion of what happens as tires roll.

For foregoing discussion see the discussion "Track Portion of a Road Course."

Mark's discovered article made me aware of the role of shear in the contact area, which I'd not considered, nor do I think I have the technical horsepower to analyze.

The temporary reduction of circumference, as the tire rolls, within the contact area makes me wonder - should we be thinking of "effective circumference" rather than "effective radius" when we consider change of constant with tire pressure?

I haven't done the calculation yet, but as the axle is loaded toward the ground, the contact area grows. There is a relation between the axle-to-ground distance and the length of the contact area. The effective circumference of the tire could, on first approximation, be the length of the undeformed portion of the tire plus the length of the contact area.

This effective circumference would act on our constant in the same direction as would "effective radius."

The above analysis needs work, but it's a start - or rather a continuation.
Original Post

Replies sorted oldest to newest

Thank you Pete.

Here is my summary of the argument, and my new experimental result which agrees closely with my thin membrane model of the bicycle tyre and differs from the motorbike tyre theory. I see no reason to expect that the coefficient of friction in normal conditions is small enough to allow much slipping to take place, which might affect the calibration constant by a large amount. I do not rule out very small effects due to slipping right at the edge of the contact patch.

Several times I have noticed that measurers have claimed that the coefficient of friction between the bicycle tyre and the road surafce affects the calibration constant, and I agree that the could be effects especially on icy roads. However, I have always been of the opinion that for ordinary road surfaces and for bicycle tyres like a racing or touring bike, there was not much slip in the contact patch between the front wheel tyre and the road. I was also of the opinion that of far greater importance in its effect on the calibration constant is the surface texture of the road. Ten years ago, I wrote a series of articles on this which appeared in Measurment News. Copies of those articles can now also be down loaded from http://coursemeasurement.org.uk/reports/

3 days ago Jim Gerwick made a posting on this board https://measure.infopop.cc/eve/forums/a/tpc/f/69510622/m/8761022113 in which he said
quote:
Also, I think the different friction coefficient for synthetic rubber vs. asphalt may be a factor.


I replied saying
quote:
Incidentally, I don't think anyone has proved that the coefficient of friction makes a difference, although I do suspect it may possibly make a contribution to the variation in calibration constant on different surfaces. What we do know for sure is that the roughness of the surface has an effect on the calibration constant. I took data on this including on a rubber track over ten years ago.


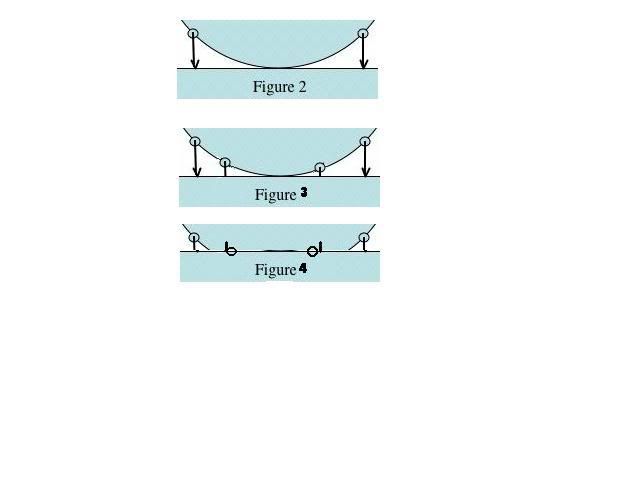
Mark Neal then entered the discussion and suggested that the tyre might be slipping over the road surface at some points in the contact patch, since the ground has to provide forces to which compress the tyre wall in the area of the contact patch, in order that the tyre can "squeeze" through the contact area (this is my short interpretation of Mark's theory). Mark bolstered his theory by quoting from a book about motobike tyres. This book quotes an approximate equation:

Ro=R-(R-H)/n where R is is the unloaded radius of the tyre, Ro is the effective rolling radius (ie the radius which gives the effective circumference and hence the calibration constant of the tyre), H is the height of the axle above the ground, and n is a constant which has the value of approximately 3 for a motor cycle tyre.

Models of car and presumably motor bike tyres are quite different to my simple model of a pneumatic bicycle tyre. I assume the bicycle tyre inner tube and tyre casing behave like a perfect thin membrane which can only transmit forces from one part of the tyre to another part in the plane tangential to the plane of the membrane at any point. In the theory of car tyres the flexural stiffness of the tyre wall plays a more signicant role, and when it is bent the tyre wall can transmit bending forces from one part of the tyre to another. It is like the difference between a thin walled toy balloon and a stiff walled ball - the former being my concept for the bicycle tyre, the latter more like a car tyre.

If my model of the bicycle pneumatic tyre rolling along the road is correct, then I predict a value of n=1. If the theory Mark suggests applies, then the value will be larger than 1, perhaps as large as 3 for a situation like a motorbike tyre.

This morning I carried out an experiment to determine n for my tyre.

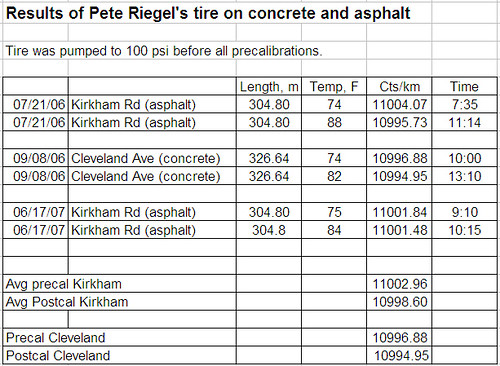
Some time ago I measured the difference between my riding calibration: 10901.8 cts/km, and my walking calibration:10802.7 cts/km. The riding calibration is 0.92% larger.

The J-O and J-R counters produce 260/11 counts per revolution of the front wheel. So we can calculate the effective rolling radius for each case, obtaining the following values:

Riding Ro = 345.1 mm Walking Ro = 348.2 mm

Now the value of the walking Ro, will be very close to the value R, the unloaded radius of the tyre, because when walking the load on the front wheel is only a few Kgs of the bike, whereas when I ride about 25kg of my weight is loaded on the front wheel. So for this approximate calculation I am going to assume that the walking Ro = R.

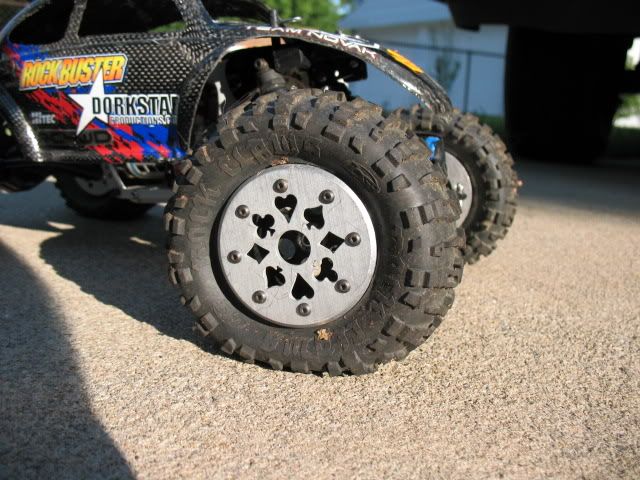
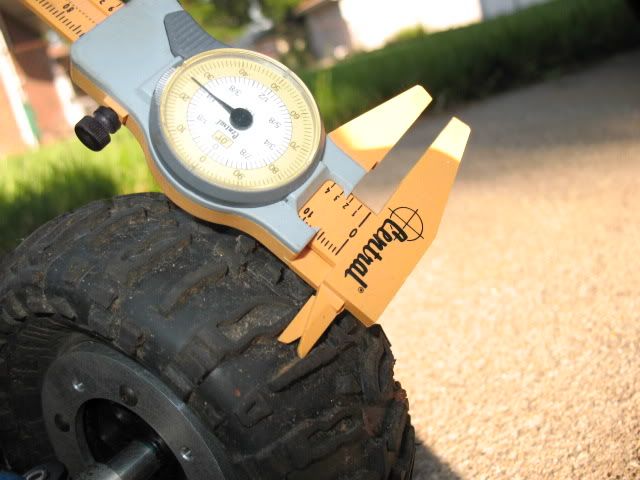
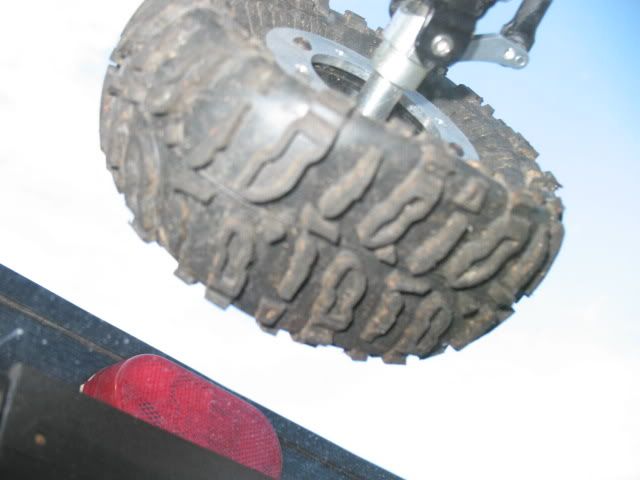
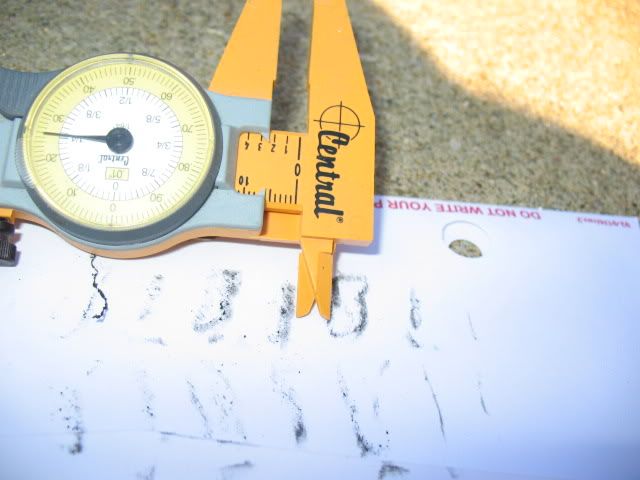
This morning I measured R-H by photographing how much the tyre compressed when I added my weight in the riding postion. I can give full details of the experimental set up separately, but basically my son photographed the movement of a pointer attached to the steel tyre rim above the contact patch relative to a vertical ruler which was attached to the ground. We took 3 pairs of readings - we can easily read the position of the pointer in the photographs with a precision of 0.2mm.

The results were :
Loaded: 15 mm 14.8 mm 14.5 mm Unloaded: 18.3 mm 18.4mm 18.3mm (N.B. the zero of the scale was above ground level)
The average measured value of R-H is thus 3.57 mm

Substituting in the rearranged formula, n=(R-H)/(R-Ro), we get n= 3.57/3.1 = 1.15. This is encouragingly close to 1 which is predicted if my thin membrane theory applies. In fact the difference between 1.15 and 1 could easily be accounted for by not measuring the weight of the bike, and various small experimental errors. Notice I got a range of values from the 3 pairs of measurements which could easily account for being the measured value of n differing slightly from 1.

What we can say absolutely for sure is that motorbike type of situation with n=3 does not apply to my bicycle tyre.

I conclude that the coefficient of friction between the bicycle tyre and the road is high enough in ordinary conditions to prevent the tyre in contact with the ground sliding relative to the ground. Except for possible small effects at the edge of the contact patch, the calibration constant will be independent of the coefficient of friction for normal roads. However, this may not remain true on icy roads with a very low coefficient of friction when even the thin wall of the bicycle tyre may produce effects similar to that seen in car and motor bike tyres.

**************I have now put up some pictures of this experiment at the coursemeasurement.org.uk website *******
Last edited by mikesandford
Good data there.

The major variable in coefficient of friction will be the road surface. If one calibrates on a concrete road, and measures on asphalt, the Cf will be off. Assuming there's a significant difference between the two.

If you really want to get pointy-headed, calibrate on asphalt and concrete, and note which portions of the course are which surface.

As far as slipping goes, I've ridden enough bikes in winter to say, you'll know when a tire is slipping.

I think the asphalt vs. concrete experiment bears investigating. Concrete is far grippier; will it yield a lower constant?
At least one science experiment begs to differ:

http://message.snopes.com/showpost.php?p=354591&postcount=8

Also, the launch area of drag strips are all concrete; the balance is usually asphalt. This leads me to believe that more traction is lent by the concrete.

In any event, it doesn't much matter who's right, just that there is a difference in Cf. Whether it applies to a rolling bicycle wheel remains to be seen. My seat-of-the-pants guess is yes, but only slightly.
I dont think I have ever had a calibration course directly on concrete. Bare concrete roads are not very common here. Here is some data on comparing different calibration courses and different tyres which I published in Certified Accurate in 1997. The table was republished in MN No 89 in May 1998. The thing to understand about the table is that a value of 100 means that the calibration constant has changed by 1m per km (ie the whole SCPF) so the numbers represent the change in calibration as a percentage of the SCPF.
N.B. All surfaces except the track were tarred surfaces containing stones of various size and sharpness as noted below. There were no loose stones.

I should like to emphasise that I think all this variation of cal constant is due to variation in surface roughness, and I do not think there is any slipping of the tyre over the surface - except possibly just at the edges of the contact patch. According to my idea of how my bicycle tyre works, when the tyre meets the road at the front edge of the contact patch, it sticks to that bit of road without sliding until, it leaves the road at the other end of the contact patch. The tyre is pressed onto the road with 80psi. This stops it sliding. Although the road imparts friction forces on the rubber parallel to the road surface, I think these do not exceed the limiting force which would be given by the coefficient of friction. As long as this is the case they tyre contact patch does not slide and it does not matter how grippy the surface is as long as it is grippy enough to stop slipping.

I think this behaviour is quite different to what happens with a typical motor car tyre where the tyre casing is so very much thicker and therefore stiffer in relation to the car weight than is the case for the bike tyre. From the papers I have looked at following my recent forum discussion with Mark Neal, it is very clear that car tyres do have significant areas where the contact patch slips. So the grippiness, or coefficient of friction, would make a difference to the calibration constant if we were measuring with car tyres.
Last edited by mikesandford
Below is the only comparison I have of concrete and asphalt. I measured both cal courses, and both are certified. Kirkham Road course is in the street in front of my house. Cleveland Avenue is in Westerville, a nearby suburb of Columbus. It’s on a newly-poured concrete sidewalk adjacent to heavily-traveled Cleveland Avenue.

On this one comparison, I obtained a smaller constant on concrete.

A better test would be to establish a cal course on the pavement of Cleveland Avenue, adjacent to the sidewalk cal course, and do comparative rides all at once.

So, for the sake of argument, let's say Kirkham (asphalt) has a ct/km of 11000.78 (average of pre-and post runs) and Cleveland (concrete) has an ct/km of 10995.915.

The difference is 4.865/km or 1.6 counts over the length of the course. That's about 30 degrees of wheel movement, or 8 inches on the ground if I'm figuring it correctly.

Not having read the measurement procedures manual lately, I can't remember the proper braking procedure, or if it's mentioned at all. Is the front brake used while measuring? I can see where braking would induce some wheel slippage, but 8 inches of it on a cal course? Doubtful that braking alone is the cause of the discrepancy.

Interesting stuff. Might be worth fitting a counter to the rear wheel to see what effect propulsion has on the count, and how this varies on different surfaces.

In reference to automobile (or any pneumatic) tires, the carcass is only thicker because of the larger amount of fabric required to support the load. Like a bicycle tire, the load is not borne by the bottom part of the sidewall (except in the case of modern run-flat tires, and there only for short distances at reduced speeds) but rather by the top portion. The air pressure allows the tire to maintain a round shape, and the weight hangs from the top portion. Think of it like a bicycle wheel. The spokes aren't strong enough to support the load in compression, but in tension they hold it easily. The "spokes" in this case is the fabric inside the tire, and the "rim" is the air pressure supporting it.

As to contact patch slipping, it's a larger patch and tends to move around a bit, especially on the steering axle. Higher speeds and greater loads also induce more slipping than you'll find in a bicycle tire. However, it does seem that the Cf plays a significant role, as Pete's data shows.
Last edited by sturiegel
There are indications in Pete's data of a reduction in cal constant by 50% of the SCPF when on concrete. I say indications because the data are not ideal, some being taken at different temperatures so a straight average will not be perfect.

Stu says that is because the concrete/rubber has a higher coefficient of friction so the tyre slips less.

I say it must be that, in common to all pneumatic tyres without very thick chunky treads, Pete's would show a lower constant on a rougher surface, therefore the concrete must be rougher than the asphalt. However, my simple thin elastic membrane model of the tyre has never explained why this should be so.

I think I need to do some more experimental work to measure the forces in my bike tyre casing. Then, calculating the compression and resulting shear forces on the contact patch, I can see whether or not Cf would be exceeded.

Stu: Measurers are indeed advised not to use front wheel braking.
It's possible that traction plays only a minor role in the ct/km discrepancy. If there's more friction on concrete, the tire will heat up more, and exhibit more growth.

Pete's data shows the opposite. The difference between pre- and post- runs is double on the asphalt surface, perhaps because of the darker color absorbing more heat. The data would support this, as the major discrepancy appears in the 7/21/06 data, taken 4 hours apart, from the cool morning to the hot mid-afternoon. While the 6/17/07 data varies by less than .4 ct/km, readings taken an hour apart, both in mid-morning.

Mike, I think your thin elastic membrane model is flawed, unless you're using high-end racing tyres (spelt it properly for you). Inflation should prevent the tire from behaving like a membrane, yes?
I'm having a little trouble with the asphalt vs. concrete arguments.

As we all have certainly observed, concrete can be finished in a number of different ways. Some of these promote traction for automobile tires, and they are the finishes we'll most likely see on road surfaces. Others do not and, I suspect, would offer less traction than typical asphalt.

But when we say "typical" asphalt, what do we mean? Asphalt pavement is laid with differing sizes of aggregate, and I suspect the friction properties differ among them. What if the asphalt is old and the aggregate is more exposed? What if the asphalt has been sealed? You don't see this much on roads, but you do in large parking lots. Is there sand in the sealer?

I think there is more than one variable here- and there may well be more unknowns than equations.
Mark: The geometric derivation is indicated in my paper 3 - The section headed "the Deformed trye effective rolling radius" starting at foot of page 5. I may have to explain it a bit more if it is not clear.

I am just working on a spreadsheet model which will enable me to plot the strain as function of longitudinal position along the contact patch. I shall then be able to model the effects of having a length at the ends of the patch where I can assume slip is occurring, and see its effect on the calibration constant. I have a hunch that it will turn out that with a 10 cm contact patch, I just need to have a region about 1 cm or so the ends where slip occurs, and have the length of this slipping region vary on different surfaces to account for my experimental measurements of pneumatic tyres. I have some mistakes in the geometry at present.

Jay: I agree there are many variations in the surface finish of asphalt and of concrete. From Pete's result I am predicting that his concrete will be rougher than the asphalt
Here’s where my two concrete calibrations fit into all the calibrations I’ve done with my tire at 100 psi initial pressure. The two big, red, circular points are concrete. The rest are asphalt.

Although the concrete constant is a bit low, it’s not quite outside the mass of the data. Still, it’s only two points. Not enough for any firm conclusion.

The key to determining the effective rolling radius of a tire is to determine the effective perimeter of the tire as it rolls. This is the only thing that matters: what is the length of the tire material that is in contact with the road during one revolution of rolling.

As weight is applied to the center of the wheel, the tire begins to flatten where it contacts the road. If there is no friction between the tire and the road, there is no external tangential force acting on the tire. So there is nothing that will cause the tire to change its length. The tire will change its shape, but its total length will remain the same. For this case, the effective radius is equal to the original radius.

In the other extreme, where friction force is very high, as soon as a point on the tire surface touches the ground it "sticks" to it. In this case, after the entire weight has been applied the tire looks like Figure 1. Because each point has "stuck" to the ground, the tire material in the arclength "s" in Figure 1 has been compressed to length "c."


Eventually every arclength "s" of the tire will be compressed to a length "c" while it is in contact with the ground, so that the effective perimeter will be given by


and therefore


Returning to the equation given by the motorcycle tire paper.

Effective radius = R-(R-H)/3

and replacing H with the expression from Figure 1.


I'm not too good at trigonometric identities, so at this point you will need to do what I did, plug in different values of alpha (make sure to use radians, not degrees) to see that both the expressions for effective radius, the one I derived and the one given in the motorcycle paper, give the same values, i.e.,


So it does appear that for the case with high friction and no slip in the contact patch, the motorcycle paper does indeed give the correct value for effective radius.
Last edited by Admin
Thanks for this Mark.

Overnight I have almost convinced myself that if one has a tyre made of a thin elastic membrane, which has a high coefficient of friction, and so "sticks" to the place where it first contacts the ground until lifted off, then a wheel cant turn! But on the other hand surely a tyre made of balloon-like material will roll? More thought is required to produce a working model.

I am also rather rusty on trigonometric identities. However, there is a convenient source in Wikipedia, although there are more there than you will ever need!

I have just checked your identity . It is an approximate identity but sufficiently accurate for our purposes up to my maximum value of alpha = 0.13 radians (7 degrees) where it is in error only in the 6th decimal place! Anyhow, that is obviously how it is derived for motorbikes, but unfortunately it now seems to me that this is not for the condition of high friction, but for riding with zero coefficient of friction, ie riding on ice!
Last edited by mikesandford
If there is no friction there is no external force acting on the tire in the direction tangent to the perimeter. So there will be no change in the length of the perimeter. For the no friction case


I had made a mistake in my earlier post in the expressions for "s" and "c" where there should have been a "2" included (Figure 1), which I have now corrected. It has no effect on the final result.
Agreed. But there must be some slip for the motorbike formula to apply. I now think that if there is no slip the overall geometry changes slightly to accommodate a shortened contact patch length. At the moment I struggling to see exactly what changes.

It seems to mean that there will slight difference of height of the axle when rolling on a sticky surface compared to just loading the static bike tyre as I did in my experiment to measure the deflection. However, I think my static measurement is still valid in demonstrating that the motor bike formula does not apply to my bike. I am still calculating...

You have demonstrated a geometrical way of deriving the motorbike formula. But this does not seem to be the whole story, since there must be slip over some portion of the contact patch to fit the tyre into the chord (or else the geometry of the simple diagram changes at the ends of the chord). I think it would be interesting to track down the actual derivation of the formula, perhaps by reading the rest of the pages not shown in the limited google book view. It would help to see if they have used anything further than the geometry you have used.
Last edited by mikesandford
I think I am moving towards a clearer understanding of the different possible situations for a rolling tyre. It is not going to be easy to write it up fully in an easily understood account, so I will restrict this post to a brief description of the different cases I have considered and explain when each is applicable.

Introduction to the problem
I first tried to think about how rolling tyres work when I was trying to understand why pneumatic tyres give a smaller constant on rougher roads compared to a smooth road, whereas a solid tyre gives a larger constant on rougher roads. My work was described in 4 papers which appeared in MN in 1998. They can be dowloaded here. The paper relevant to the present discussion is number 3, in which I tried to model the rolling pneumatic tyre. I derived a formula which enables one to calculate the effective rolling radius from the tyre radius and the axle ground separation. The formula depended on the assumption that there was no slipping between the road and the contact patch. I here call this THE NO SLIP CASE.

I did not succeed in finding the cause of the variation in calibration constant with roughness, but I did eliminate one possibility. I concluded:
quote:
Surface roughness effects probably arise in the region near the point of first contact between the wheel and the ground where they affect the amount of initial circumferential compression of the tyre. I speculate that there are three possible causes:
1) tyre deformation extending beyond the point of first contact,
2) road height irregularities modifying the geometry of initial contact,
3) varying skidding at the point of first contact.

After reconsidering the analysis which appears on page 5 on Paper 3, entitled "A Deformed Rolling Tyre:Effective Radius", I think the derivation there still stands. I would now clarify conclusion 3 and say that a cause of calibration variation may include 3) varying skidding in the region very near the point of first contact.

Prompted by Mark Neal I have now examined two other possible cases:
1. The case given by the MOTOR BIKE EQUATION for which Mark has pointed out a geometrical/trigonometrical derivation. This case must some involve slipping over part of the contact patch. The Motor Bike equation also enables one to calculate the effective rolling radius from the wheel radius and the height of the axle above the ground.
2. The case when there is NEARLY ZERO FRICTION CASE. In this case the tyre circumference does not change length, and the effective rolling radius in equal to the tyre radius.

THE NO SLIP CASE

In this case I find that the effective rolling radius is equal to the axle/ ground separation. When the tyre meets the ground at an angle at the and of the contact patch it is slightly compressed and the friction forces hold it at a constant value of strain as it passes under the axle. If the strain were to vary then the tyre would need to slip, contrary to the assumption I made for this case.

MOTOR BIKE EQUATION CASE

In this case when the tyre meets the ground it does not stick, there is a region for which it slips and where it is compressed by the forces provided by the coefficient of sliding friction. As the piece of tyre moves through the contact patch towards the axle it encounters an area where it stops sliding, the static friction is then sufficient to provide the necessary forces. In this case the effective rolling radius is intermediate between the NO SLIP CASE and the NEARLY ZERO FRICTION CASE

NEARLY ZERO FRICTION CASE

In this case the tyre slips everywhere throughout the contact patch. We assume just sufficient sliding friction to ensure that the wheel turns. Since the longitudinal circumference of the tyre is not significantly changed the rolling radius equals the tyre radius.

Conclusion of the work
In the second post of this thread I posted the results of an experiment to measure the axle ground separation. When I considered the variation of constant I find between riding and pushing the bike, I found that for my pneumatic tyre the riding calibration fits THE NO SLIP CASE, and excluded the MOTOR BIKE EQUATION CASE and the NEARLY ZERO FRICTION CASE.
Stu: I hope the above is not written in a too pointed headed fashion.

That is a nice paper you have linked, but not of much relevance to the the measuring wheel, since we operate in a tiny region at the 0,0 point in the centre of fig1. A tiny force is required to overcome the rolling resistance of our front wheel, and I think it can be ignored.
Incidentally, the magic formula referred to in that paper is well named. It is an experimental equation which fits data which I guess tyre engineers derive from tests on car tyres. I dont think it is derived from a model.

By comparison the formula I have for the NO SLIP CASE is derived from a formula deduced a simple model.
Mark,

Your discussion is way beyond my mathematical experience, so I won't even try to go into a math-based argument. But, doesn't your diagram above show that the effective radius is based on the height of the axle above the ground?

"H" seems like it dictates that the effective circumference is based on the height of the axle, and is totally independent of "R". If you have a balloon tire, somewhat under-inflated, would that not be a simple experiment to execute? I have no pneumatic tires, balloon or otherwise, so I can't perform the experiment.

Just observing from the sidelines, while you mathematicians discuss, and try to make sense of your arguments. It's giving me a headache, though!
Duane,

I know it seems like the effective radius being the axle's height to the ground should be the right answer, but it's not. The tire is not a circle anymore, so the effective radius is going to be dependent on what new deformed shape it takes, not simply the axle's height to the ground.

To give you a simple example to help convince you, consider a wheel made of a flexible hoop with a 1-foot radius and spokes replaced by strings. You could squash this hoop down into some odd shape with the axle only a couple inches from the ground. But the effective radius would still be 1 foot because you didn't change the perimeter of the wheel by squashing it down. In one revolution you will still travel 2*pi feet.
Mark:
I can't calculate the precise deformed shape so I cant draw it with certainty. However, by measurement and calculation I do know certain features of it so I could try illustrating these. I really need to illustrate the compression in the tread and for the cases where there is slipping, show this. The only way I can think of doing this is accompanying the diagrams for each of my 3 cases with graphs. This will take time to do, but if it really helps I will do it. However, I cant help feeling that people should be convinced by my experimental result even if I have not drawn a picture:

For the benefit of all I reiterate the experimental steps and the key argument here:

(First, note I have just corrected a mistake I made in rearranging the formula in the second post of this thread. I originally got the formula upside down I had n=0.87. Now the corrected version reads n=(R-H)/(R-Ro), we get n= 3.57/3.1 = 1.15. This is encouragingly close to 1 which is predicted if my thin membrane theory applies. In fact the difference between 1.15 and 1 could easily be accounted for by ..... This mistake does not affect my conclusions.)

1. I measured the calibration constant walking the bike. From this I calculated the effective rolling radius of the tyre when not loaded. This I used as the value for R in the above formula.
2. I measured the calibration constant riding the bike on the same calibration course. From this I calculated the effective rolling radius of the tyre when loaded with my weight. This I used as the value for Ro in the above formula.
3. In the static experiment described in post 2 of this thread, I directly measured how much closer the axle got to the ground when loaded. I did this by measuring the rim to ground distance when I put my weight on the bike. This gave me the value of R-H, H being the height of the axle above the ground when loaded. When there is no load, the axle height will be R.
4. I put the measured quantities into the equation and found that n was 1.17 (+/- 0.2 to allow for my measurement errors). So the true value of n may be anywhere between 0.97 and 1.37, most probably it is very slightly larger than 1, but is certainly not as high as 3 which apparently applies for motor bikes.
5. Ten years ago I developed a simple theory based on NO SLIPPING of the tyre over the ground. This theory results in n=1, so can explain the observed results.

It does indeed turn out that the effective rolling radius is very close to the height of the axle to the ground. If it differs at all it is less than 1 mm larger than the axle height.

It is quite easy for measurers to repeat for themselves step 1 and 2 above. Step 3 is harder to do accurately. I did it with the help of an assistant to photograph the compression of the tyre with my weight bearing on it. I would be interested to hear if others manage to do this. We could then find out how many tyres are similar to mine and according to my theory do not slip over the area of the contact patch (or at least only slip over a small part of the contact patch area.)
Last edited by mikesandford
quote:
I really need to illustrate the compression in the tread and for the cases where there is slipping, show this. The only way I can think of doing this is accompanying the diagrams for each of my 3 cases with graphs. This will take time to do, but if it really helps I will do it. However, I cant help feeling that people should be convinced by my experimental result even if I have not drawn a picture


I definitely wish you would. So far you haven't provided any explanation as to why R=H. Your experiment is interesting, but I am more convinced by the fact that neither of us has been able to find anyone in the literature, anywhere, that has claimed R=H under any circumstances.

You say that my drawing of the loaded tire in Figure 1 can only be true if the tire had slipped. This drawing looks exactly like the one from your write-up that you used during your argument that R=H. But anyway, please draw a picture that shows what the loaded tire looks like if it doesn't slip. In order for R=H, the length of the contact region needs to be shorter than what I have shown in Figure 1. How does this happen?
I am not very good at drawing, it is easier for me to show it as calculations and arguments, because I don't know how to show the compression of the tyre in a drawing. Here is a sketch roughly to scale. I have magnified the area around the contact point by 20 times so that you can see the difference between the 3 cases. It is only a range of 0.9% between the No-SLIP CASE and the NEARLY ZERO FRICTION CASE - these are shown by dashed lines when not touching the ground but I cant calculate exactly the shape assumed there. The MOTOR BIKE CASE lies between these two extremes and is shown by the heavy line in the magnified region. The 0.9% change in the contact length does change your angle alpha at the wheel axle, but the effect of the change on the geometry is negligible and in particular it does not affect the axle ground height significantly or the rate of feeding uncompressed tyre into the contact area.


I am not very familiar with the literature. When I searched 11 years ago in libraries, I found very little. Searching is so much easier now since so much more is found by Google (in fact I dont think I used Google then which was just in its infancy as a University project). What a change in 11 years. Google now turns up numerous text books as well as a lot of research papers. I cant say whether anyone has treated the rolling bicycle wheel. The purpose of nearly everything I have seen so far is treating the problems of how to accelerate, brake, or corner a car, or a motorbike. There are many papers which I have not looked at on steel wheels rolling on steel rails, which I have assumed would not be applicable. I am not surprised we have not so far found someone treating something equivalent to the measuring bicycle wheel. We may well have to go back to the era of Whipple's 1899 paper to find a treatment of the simple rolling-no slipping case.

Now I have a better idea what to look for I will spend some time in the book shops in Cambridge on Sunday. I will also search the library indexes for Oxford. But these are rather long term projects. It would be really helpful if anyone can lay their hands on a good treatment of the bike wheel.

You ask:In order for R=H, the length of the contact region needs to be shorter than what I have shown in Figure 1. How does this happen?

It is shorter because the tyre does not slip and its longitudinal compression is constant everywhere along the length of the contact patch. For the motorbike formula to be true, the friction with the road is not able to provide the necessary compression of the tyre near the end of the contact patch so the tyre slips and has a lower average value of compression, this means that the contact region is in fact longer than the no slip case, which has a 0.6% smaller value for your angle alpha. There have to be changes to the tyre geometry outside the contact patch which enables this to happen without changing H. As I see it the whole non contacting part of the tyre changes slightly so that it is no longer an arc of a circle.

This is what I am finding difficult to calculate and then draw. We would be able to do it with a full finite element model of the tyre, but I do not have access to any finite element software. Is there free software available? Even then I should think such a model would take a week or so even in an expert practitioner's hands. I would rather rely on my experimental data, and it would be great if someone else could get measurements to compare.
Last edited by mikesandford
Pete, Good work. I checked the geometry and got 326.4516m A 2.4 mm disagreement is not worth investigating and wont affect your overall result.

So I predict your concrete is indeed a lot smoother than your asphalt. Can you post macro digital photos of both surfaces?

Better still try a trick that a road engineer once described to me. Take a measured volume of fine dry sand and brush it into the surface so it just covers a patch. Roughly estimate the area of the patch. Repeat on the other surface. Compare the areas. The larger the patch the smoother the surface. I have never actually followed this advice, and I can see somethings wrong with it.

For the measurement of the Sydney Olympic course I got Hugh Jones to make castings of the surface and send them to me for inspection, and correlation with the results from the different measuring tyres used. There was some qualitative explanation of which riders got which distances, but overall there was too much going on to make much of it, and I never wrote it up.

By a coincidence Hugh has just left two days ago to measure Bejing with Dave Cundy. I did not suggest the experiment again. He has got more important things to do than feed my curiosity!
I had thought that deformation of the tread and friction would lead to heat build-up in the casing, and that friction would play a part in this. Clearly I was mistaken.

Pete's experiment shows that heat in the tyre does not appear to be a factor. If it were, the count would run down with each run, and it clearly does not. Which leaves us with surface friction/tyre slip as the cause of the discrepancy.

quote:
You ask:In order for R=H, the length of the contact region needs to be shorter than what I have shown in Figure 1. How does this happen?

It is shorter because the tyre does not slip and its longitudinal compression is constant everywhere along the length of the contact patch. For the motorbike formula to be true, the friction with the road is not able to provide the necessary compression of the tyre near the end of the contact patch so the tyre slips and has a lower average value of compression, this means that the contact region is in fact longer than the no slip case, which has a 0.6% smaller value for your angle alpha. There have to be changes to the tyre geometry outside the contact patch which enables this to happen without changing H. As I see it the whole non contacting part of the tyre changes slightly so that it is no longer an arc of a circle.

This is what I am finding difficult to calculate and then draw.


I see where this is going. As the tread surface is flattened, its deformation causes the tread to creep backward (opposite the direction of rotation). The already-compressed bit at the center will not slip, due to available traction, so the leading edge is forced to do so. This action slows the rotation of the wheel.

Roll a ball of dough across a table, and you'll notice a fat little ridge develops at the leading edge where the dough meets the table. It develops because you are forcibly rolling it. With a bicycle tire, this action would be much less pronounced, but the data supports it.

I'm not surprised you're having a hard time calculating and drawing it.

The available traction being the limiting factor in slowing the wheel's rotation, different surfaces would produce different calibrations.

This is getting good.
Our tyres dont heat up at 10 mph max. Although I was told when I started measuring to ride around before calibrating. I have never actually been able to measure the effect - it seems it must be too small.

Rolling dough - that is another nice experiment we can do Smiler

Seriously though it is a good idea. One way to see what is happening would be to alter the parameters so the effects are much larger and we can easily see them and perhaps photograph the shape. We need to construct a pneumatic tyre from materials which will greatly magnify the effect.
CONCRETE Vs ASPHALT

I did not spend enough time on Pete's Cleveland road data reported yesterday, to notice that there are indications that the Kirkham road asphalt gives a calibration constant that differs from Cleveland road asphalt by a fraction comparable to one whole SCPF (ie 1.00102).

Here are Pete's data presented in the same format of my contribution to this thread posted 7 July 2008 at 22:06. I have taken The Cleveland Road concrete as the reference calibration course. A positive precentage indicates that a course on that surface will be found long when measured by a bike calibrated on the reference surface. + 100% would mean that the course would be measured by the bike to be long by one whole SCPF.
Kirkham asphalt	         11000.78		+ 44%	smoothest surface?
Cleveland concrete	 10995.92	11003.2	reference calibration	
Cleveland asphalt		        10996.8	- 58%	roughest surface?

I hope I have got all the signs the right way round.

The point is that it suggests the Kirkham asphalt is greatly different to the Cleveland asphalt. Even if one allows for the fact that there is a lot of scatter in the graph of historic data which Pete first presented, I still think it would turn out that Cleveland asphalt is quite a bit rougher than the Kirkham asphalt.
Last edited by mikesandford
All three of the calibration courses are very smooth. While riding them I felt no bumps or irregularities enroute. The asphalt courses have no cracks in them, and the surfaces look about the same to my eye.

The concrete sidewalk is less than two years old, and no settlement has occurred to create bumps enroute. It's very smooth.

As the Cleveland Avenue course is 15 miles away I doubt I'll be getting back there soon to take macro photos.
Pete,

Can you add these new data points to the chart you showed previously? I think it might look like the new concrete points and the old concrete points are just subject to the same scatter as all the other points you have.

However, the fact that you did these two new rides (asphalt vs. concrete) at the same time and got different constants does indicate there's a real difference.
When I, and the motorcycle folks, derived our effective radius formula for the case with very high friction and no slip, we assumed that as you pushed down on a tire, the points on the surface of the tire would move straight down until they touched the ground (as shown in Figure 2 below), and then they would stick there, resulting in the configuration shown in my original Figure 1.


Mike has suggested that the contact patch is shorter than this. This would mean that as the tire moves down under the weight of the rider, the points of surface of the tire move in toward the center of the patch as shown by the red arrows in Figure 3.


Mike, what force is causing this to happen?
Last edited by Admin
The points on the tire move closer together because the contact patch is a straight line, not an arc. The weight of the rider and the rigidity of the road compresses the tread. Only an unladen bike has a single point of contact as in your illustration.


Taking your original Figure 2, I moved the points in a bit to make Figure 3.

Figure 4 shows the effect of compressing the arc into a straight line, as in a real contact patch. The circles are in the same place on the tread surface. The vertical lines are in the same place in real space.

Since I used MS Paint and not a real finite-element modeling program to do it, I'm sure the effect is exaggerated, but you get the idea.
Mark:

Very slightly different things happen when you compress the wheel without rolling it as shown in figure 2, compared to when you roll the wheel along the road.

Your figure 2 is correct for static loading if the tyre does not slip at all on the road. This is what would apply in the case of my static experiment described in the second post of this thread.

A feature of the this static compression is that the portion of the tyre which touches the ground first is not compressed at all in the longitudinal direction, whereas as we move towards the ends of the chord there has to be an increasing compression to fit in the tyre material which is at a small angle to the ground. The compression of the tyre thus varies along the length of the chord. This is OK for a static compression with no slipping.

In rolling something subtly different happens for the no slip case:

As the wheel rotates each new bit of tyre does not come into contact with the ground immediately underneath the axle - the touching point shown in your fig 2. It first touches at the end of the radius marked R in your fig 1:


As each new bit of tyre gets fed in to the contact patch it is compressed to fit. The longitudinal compression (which is all we are concerned with in this simplified argument) is cos(alpha). The compression remains constant as this bit of tyre passes on under the axle until it is released as the tyre lifts from the road at the end of the chord marked c in fig 1.

Whoops! Just as I have written this I see Stu, ever on the ball, has just posted. I have not yet quite worked out the implications of his post.
Per Mark's request, here are all my precalibration rides with my tire at 100 psi initial pressure. I eliminated the postcals because varying time had gone by since the pump-up. All precal rides took place within 10 minutes of pump-up.

Although the concrete points seem low, the best comparison is the one done side-by-side on the same day at the same time and temperature. Scatter of the data can be partially attributed to variation of the initial pump-up pressure. I took my best shot, but there’s always variation.

That's okay, I haven't worked them out either.

I have, however, come up with an imperfect model to show that tread compression is real.

The victim is one of my model rock crawlers, chosen for its supple, compliant tires and easily-measured tread lugs.


The large and small lugs are .255 inches apart when the tread is uncompressed. Forgive the use of Imperial units.


I don't have a piece of glass large enough to support me on my bike, so this will have to do. You can see how the tread flattens out under the load of gravity.


The moment of truth. The caliper, set at .255, will not fit between the impressions made by the lugs. This was not a rolling impression but a static one. Best measurement comes in at .245, for a compression of .010 on a 5-inch OD tire.

The model is imperfect for the following reasons:

1: the contact-patch/diameter ratio is wildly exaggerated.
2: measurement the impression is somewhat imprecise, due to the nature of the impression (dirt on ATM envelope).
3: the tire itself has no fabric reinforcement; it is pure synthetic rubber. Fine for its intended purpose, but unsuitable for a bicycle.
4: the tire is not pneumatic, but supported by foam inside the tire, for technical reasons we won't go into here.

Nevertheless, the model shows that tire treads do, in fact, compress when flattened out. Take this for what it is worth.
Stu:
That is a compression of 4%. Your experiment demonstrates how to increase to magnitude of the deformations so that they are easier to measure.

I dont think it should matter using a tyre without a fabric reinforced outer casing. The main effect of the fabric reinforcing in the casing is that the nylon fibres are stretched and it is their stretching which determines the wheel transverse crossection when pumped up, not the elasticity of the rubber inner tube. The tyre is able to operate at a much higher pressure with the stiff nylon fibres reinforcing the casing.

I am thinking of using a bike wheel with an inner tube but no outer tube in order to magnify the effects. With an inner tube only the tyre is inflated with a much lower air pressure; the contact patch is large to support the rider's weight. Instead of the fractions of 1% compressions, which happens with a normal bike tyre, we should get a much greater percentage compression, and be able to measure the variation of compression along the contact line, and compare rolling and statically loading the tyre placed on a sheet of glass, with the compression photgraphed from below. One would need to paint a scale on the rubber to see the compression through the glass.

One worry is whether the tyre will balloon out so much it wont pass between the front wheel forks. Then there is the worry about punctures.

On the other hand if I can explain my theory to the satisfaction of all, then perhaps more experiments are not needed.

I am not that surprised that we have not so far been able to find car and motorbike tyre designers paying attention to this specific problem. It is of no obvious importance to their practical problems of keeping the vehicles on the road and having a low rolling resistance. The effect is very small unless we manage to magnify it. It is only course measurers who employ techniques which calibrate the effective rolling radius with sufficient accuracy to reveal the effects and then start worrying about them.
Another nice thing the fabric does is contain the growth of the inner tube. I hope you'll be able to get enough pressure into the tube to obtain a useful result.

You'll likely observe the leading edge of the tube creeping away, rolling up like the dough ball, with no casing to restrain it. Time will tell.

At this point I must bow out, as I leave early tomorrow for six weeks of company training, away from such things as keyboards, but quite close to high-pressure tyres. Enjoy the experiment; I hope the results are useful.
Stu,

Yes, there is compression of the tire in the contact patch. But this is caused by the points on the tire moving straight down. The length of the tire between the two points shown in my Figure 2 is longer before they are pushed straight down to touch the ground. Those points don't need to move toward the center of the contact patch for there to be compression in the contact patch.

Your figure 2 is correct for static loading if the tyre does not slip at all on the road.

Mike, you're agreeing with me for the static case but you're saying that the case with rolling is different, and for that case the contact patch will be smaller. Is this correct?
6 posts up I said
quote:

Very slightly different things happen when you compress the wheel without rolling it as shown in figure 2, compared to when you roll the wheel along the road.

It is of course the rolling case that is relevant for measuring, which is why I treated it 10 years ago.

My crude diagram posted on 10 July does indeed show a shorter contact patch labeled NO-SLIP CASE with a length of 2*46.084mm. The static case is labeled MOTOR-BIKE-EQUATION CASE and this has a contact patch length of 2*46.3569mm, which is longer.

It is correct to say that rolling pneumatic-tyred bike wheel (assuming the tread and walls are not too stiff so that there is no slipping between the tread and the road) will have a shorter contact patch than the same wheel pressed vertically onto the ground with out rolling.
So when you sit down on your bike and remain still the effective radius is given by


But then when you start rolling forward the effective radius becomes


So when does this transition take place? As soon as you start any slight roll forward the "n" in your equation jumps from 3 to 1? Or does it slowly change from 3 as you build up speed until it reaches 1, and then stays at 1 no matter how fast you go?
Mark,
I am just repeating the same thing. But here goes again:

  • When I ride a calibration course I find the effective radius for riding which call Ro
  • When I walk my bike along the calibration course, I assume I can ignore the effect of the bike weight so I measure the undeformed radius of the tyre, R
  • When I sit on the stationary bike I can measure R-H.
  • When I plug R-H into the formula I find n is not 3 but something equal or close to 1 (within the limits of my experimental accuracy.

n never does equal 3 for my bike. There is no meaning to effective rolling radius in the stationary case, because definitions of the effective rolling radius relate the angular velocity of the wheel, omega, to the bike velocity, V. ie Ro=V/omega.

Alternatively if you do not want to use velocities, then you recast the definition in terms of numbers of wheel rotations and distance covered, and this is of course how we as measurers do it.

It is a very simple set of measurements which you could do for yourself, perhaps with the help of an assistant lying on the ground with a ruler against the tyre to measure R-H.

You are getting completely hung up on the motor bike formula with n=3. Doing the geometry for just sitting on the bike does not make n=3, the wheel is not rolling so there is no meaning to the effective rolling radius. There is not a question of a transition from a stationary case to a moving case. If you were to roll the bike wheel at any speed, accelerate from rest at any modest measuring rate, then the formula will always give n=1 when you relate Ro to R and H - all these are constants for a given tyre/rider weight combination. If it was not so we would have real problems in course measuring.

The motor bike formula is a geometrical construction, which as you have shown, when n=3, relates the chord which forms the length of the contact patch to the length of the arc of tyre which has been compressed into the contact patch. What this simple geometry does not show is the slipping between the road and the tyre. If you assume you just press the tyre down without rolling the bike forward you get different compressions along the the contact line, than in the rolling case with perfect sticking of the tyre. I could try and draw some graphs of this. But I fear it may be wasted effort if you are going to stick to n=3 type models for the measuring bike.
Last edited by mikesandford
Mike,

You agree that the contact patch is Rsin(alpha) when the bike is at rest. You claim it is smaller than that when the bike starts to roll forward. You have provided no explanation as to why this change occurs.

How about this experiment. Put a weight on the front of a bike and walk it along a calibration course at a "modest" speed. Then repeat the process but this time walk much slower. Do you think you'll see a change in the cal constant? How slow do you need to go so that there will be a difference? If you are claiming there is some dynamic effect of rolling that causes this change in contact length, then there must be some speed slow enough that the dynamic effect is negligible, and it would return to the static contact length. If you understand this dynamic effect then you should be able to tell me how slow I need to go to see this start to happen.

I am "hung up" on n=3 because I have a proof that says it's correct for the static case, which agrees with the folks who wrote the motorcycle book. You claim I'm wrong because the rolling case is different than the static case. You claim they are wrong because they're talking about a motorcycle tire, not a bicycle tire. Don't you find it odd that two people who are wrong for completely different reasons get exactly the same answer?

There is not a question of a transition from a stationary case to a moving case.

Sure there is. When I first get on my bike my contact patch is such that n=3. When I start moving you claim it changes to n=1. If you understand why n=1 for the rolling tire then you should be able to explain this transition to me.
Mark:
Pressing down on an uncompressed tyre is a different situation to rolling the tyre. The detailed transition between these two cases does not interest me, since it is of no importance to my model. And in practical terms it does not really matter what happens if I place the bike tyre at the starting nail press down to load it, then ride off. The transition will be complete within about 15 cm.

If I now stop the bike keeping my weight on the wheel it will retain the compression distribution for the rolling case. If I start riding again, there will be no change of compression because the tyre already has the rolling compression set up in it.

I dont know how many times I have to say the static loaded case is different from what I observe when rolling. It will also be different from the rolling motorbike wheel with n=3. This is because the distribution of tyre compression is different. Here is what a quick calc gives for the two cases for my tyre:
You are wrong because you are not considering these compression distributions. There is not enough information in the visible pages of the google limited view of the motor bike book to say why it does not apply, but it will certainly involve different compression. What we do know for sure from my experimental data is that n=1 not n=3 for my bike. My theory fits n=1, so what more do you want? Lots of references quoting my case? I admit I have not found any, but this does not invalidate my theory, which is really incredibly simple - almost trivial and I suspect is too far from the sophisticated problems that tyre modellers tackle to have been explictly examined by many people.

I think you should try and show what is wrong with my experiment, and my theory rather than quote n=3 at me.
quote:
My theory fits n=1, so what more do you want?


Well, the picture certainly helped. I finally get it. I must say though, I just wish you would have drawn a diagram like the one below to explain it when I asked:

Mike,

What is the geometric derivation for the case with the perfect stick condition that leads to

effective radius = H.


Because there IS a simple geometric argument.


Each small length of the tire that becomes part of the contact patch changes its length from Rd(alpha) to Rd(alpha)cos(alpha). So the effective perimeter changes by this same factor of cos(alpha) and so does the effective radius.

effective radius = Rcos(alpha) = H

The transition from n=3 to n=1 is not a dynamic effect. It will occur as soon as all of the contact patch that was created by pushing straight down is replaced by contact patch that is created by rolling, no matter how slowly.

Thanks for being so patient with me while I struggled to understand this.
Mark:
I thank you for the discussion. For me the highlight was that it prompted me to measure the tyre's static compression and thus I was able to calculate n for my tyre.

Another good thing is that with your prompting I am now aware of a literature on tyres. The downside is that I really ought to do a lot of reading and understanding in order to puzzle out just how the models of car and motor bike tyres relate to the measuring bike. You might have thought that the measuring bike tyre would appear as a special case in the formulae given by these other works - but I have not found it yet.

The key explanation of my model for the rolling measuring bike tyre was given in my 1998 article.

quote:
A Deformed Rolling Tyre: Effective Radius
Implicit in the discussion so far has been the assumption that the effective rolling radius is given by the distance between the axle and the ground. If there is no slipping between the tyre and the ground and if the axle location remains at the centre of the wheel, then some simple geometry leads me to the conclusion that the assumption is true. If Re is the effective rolling radius, then as the bike moves forward a small distance δx, the angle through which the wheel turns is δx/Re. Imagine now the small length, R*δx/Re of undeformed tyre at the end of the radius in the adjacent figure, just about to contact the ground, as the wheel moves forward δx. If this piece of tyre is not to skid when it touches the ground, then it must approach the ground with no horizontal component of velocity. This statement would not necessarily be true for a light tyre with no mass which needed acceleration. I assume that the tyre is a heavy membrane having a finite mass per unit area. Thus any area making contact with the ground with a relative horizontal velocity will need an impulse to remove the relative velocity and this will cause at least momentary slipping contrary to my assumption of no slipping. The horizontal component of displacement of the tyre is δx towards the right and R*δx/Re cosβ towards the left. For no relative motion,

δx=Rδx/Re cosβ which gives the effective rolling radius Re =R cosβ which is the axle ground separation.

Another interesting aspect of the mechanics of the rolling deformed wheel is that the tyre is placed under circumferential compression. The small element R*δx/Re considered above is compressed to length δx on making contact with the road. This is a compressive strain of R/Re – 1. ........


In this 1998 article I went on to briefly address the variation of compression. I was clearly struggling to understand the rest of geometry of the situation and what I wrote then about the variation of compression along the contact patch was wrong. There is no variation since I have assumed perfect sticking, what happens is that the contact patch is a bit shorter than in the static case because of the different average compression.

I think I could write the quoted explanation better now, and Mark's nice diagram given in the post above would be better than what I drew in 1998:

Although curiously I note that I left a small gap between the end of the radius at the angle β and the point of first contact of the tyre and the ground.You will see in the rest of that paper I speculated about what might be happening there to cause a variation of the constant on different surfaces. It is very much part of my present thinking that there is a small region there where there is some sort of transition, and this may be where sliding and surface roughness effects (and indeed the coefficient of friction) may play a role.

Now I am off to Cambridge, where I hope I will have time to look in some bookshops.
Mike,

I think there are two key differences between bicycle and automotive tires. One is that, as you point out, automotive tires are more of a 3-dimensional problem because they are thick-walled, and also have thick sidewalls which play a roll. The second is that according to what I have read, automotive tires have very little change in their effective radius. This is because they are very strong, especially steel belted radials, and won't change their length much. Even though the contact patch is under compression (or really, not under tension like the rest of the tire) this does not cause much strain, or change of length.

Summarizing (mostly for my own benefit) for bicycle tires, the situation is


And the question is, what Zone(s) are we operating in? If we are always in Zone B, where the friction is high enough to create a stick condition, friction doesn't matter. If we are sometimes in Zone A, then friction does matter. Automotive tires must always be in Zone A, because their effective radius is always close to R.
Keep in mind that slipping in the contact patch does not imply total loss of traction. Automotive tires surely have some slip in the contact patch, yet you are able to go around corners without crashing into the guardrail.
Last edited by Admin
Yes, it all depends just how much of the contact patch is slipping. There is obviously zero or almost zero of the contact patch slipping for the measuring bicycle. Change of friction could have a small effect on calibration constant if a tiny bit of the contact patch slips at the edge.

However, so far I have not been able to explain the results of both my solid and my pneumatic tyre calibrations on a wide variety of surfaces in terms of friction variations in a small sliding area of the contact patch. But I will continue thinking about it.

Cambridge bookshops were a washout, and the libraries where closed on Sunday. So I have ordered some books in the Radcliffe Science library in Oxford to read tomorrow, including Tyre and vehicle dynamics by Pacejka, H. B. which is probably a definitive book, judging from what can be seen in the Google limited book view.

I may also look in the Norrington room of Blackwells, which is pretty good for recently published books still in print.
Hello all,
I have been reading with fascination. I haven't digested it all yet, but I'd like to suggest that the coefficient of friction might have a little to do with the effective radius, and I don't think it can be assumed to be negligible.
I'd suggest a wet vs. dry calibration run (same surface) to see what mpact it has. I'm sure the data is there somewhere.

As the tire rolls and deforms, there will be a limited amount of slip taking place between the tire and the road. More deformation, more slip.

At the initial point of contact with the road, the tire radius is unchanged. When this point becomes the center of the patch after rolling forward, the radial distance has changed due to compression.

I think the forces may average out on the front/back of the patch when rolling, but it is certainly slipping one way until it reaches the center of the patch, and the other when it passes.

Just a thought.
Tom
Tom:
I agree that sliding of the tyre within the contact patch is important in significant acceleration, braking and cornering, but you have to remember the measuring bike wheel is an almost perfect freely rolling wheel. The small rolling resistance of the wheel is overcome by friction at the road surface. I think the wheel does not need to slide at all in the contact patch or at least only in a very very small area of the contact patch.

I find some support for my view in the words used by Hans Pacejka on page 3 of Tyre and Vehicle Dynamics. After describing free rolling (ie zero rolling resistance) he goes on to say:
quote:
When a wheel deviates from this by definition zero slip condition, wheel slip occurs that is accompanied by a build-up of additional tyre deformation and possibly partial sliding in the contact patch

I have emphasised the word possibly, since presumably Pacejka is implying that it may be possible to overcome rolling resistance by means of friction and deformation of the tyre without any sliding in the contact patch.

I have had a lot of difficulty with applying the concept of sliding in the contact patch to the measuring wheel. I think many people are trying to ascribe effects that are important for moderate and severe braking, cornering and acceleration, to the measuring case which is almost perfect free rolling.

I am putting a lot of faith in Pacejka's words. His book is said to be a suitable reference for Master's and Doctorial Research Students, and it may well be one of the one of most authoritative sources available outside papers in scientific journals.

Finally I would just like to clarify something that confused me for years, and has only become clearer over the last few days as I have read up more on the car tyre calculations:

The term SLIP RATIO can be somewhat misleading to the to the uninitiated. It does not necessarily mean that tyre is slipping or sliding over the road. This may be happening in part of the contact patch, but some or all of the tyre contact patch is firmly attached to the road. What slip ratio is related to is how the angular velocity (RPM) of the wheel changes, accompanied by changes of the effective radius, so that the bike speed remains constant. A key to understanding what is going on is to realise that SLIP does not mean SLIPPING across the road surface. I think the choice of word for the term can easily lead to understanding difficulties. It seems to lead to some misstatements by people wrestling with tyre problems, and partly explains some of my difficulty in understanding.
Last edited by mikesandford
Scott,

They are trying to mathematically explain the difference in measurements when the pavement is smooth (concrete) vs. rough (old asphalt, chip-seal, etc).

From what I can gather, there may be a difference of 10 - 15 clicks over the course of a km, or 10 cm per km. So no, there is no significant impact on measurement for the rest of us.

I would take issue with the first postings on this page that warmup riding has no impact. I definitely notice a difference when I take my bike from my garage (unheated, but still warmer than the outside for 7 months of the year) then ride. If I go straight (10 yards) to my cal course from my car, my first ride is 3-5 clicks greater than all subsequent rides. I have airless tires, so the warmer rubber squishes more than when it cools down to pavement temperature (as shown in one of Mark's illustrations above). In my opinion (or is that now IMO?), acclimating the tire is a valid requirement for calibration rides.
quote:
I'd suggest a wet vs. dry calibration run (same surface) to see what mpact it has. I'm sure the data is there somewhere.


Tom,

I thought about this a while back, but the problem is that there would be evaporative cooling of the tire, so the effect of friction wouldn't be the only thing you'd be measuring. However, cooling would tend to increase the count, while reducing friction (if it matters) would tend to decrease it, so maybe it is worth doing.
I share some of Scott's wonderment about where this may be going, but I'm glad to see it. With people exchanging views, occasionally a new idea will pop up. The subject being discussed is obviously of interest to those participating. Not every post will be of interest to every reader, but without wide-ranging discussion new ideas will be scarcer.
I thought this thread might die down a bit once Mark and I had come to some agreement over what is going on in our pneumatic front wheels. No such luck as a number of further points have been raised over the last day or so.

Scott: In one sense this thread has no impact on "everyday measuring". You layout your calibration course calibrate the bike, and using the largest constant measure the race course. That is pretty well it for most measurers.

On the other hand it can be useful to understand something about the variation of calibration with the nature of the road surface, if you are in the position of having to compare different measurements of a course, where different tyres or different calibration courses have been used. It is another possible source of variation in the measurement result, along with more familiar sources of variation which new measurers are usually taught about eg variation of temperature and not riding the SPR. For example, someone validating a course and getting a different result from the original measurement might well ask himself whether the calibration surface, which he has used, is
1) Representative of the race surface,
2) Similar to that used by the original measurer.
He would not get a quantitative answer - without a large amount of work - but there could be a qualitative indication of a contribution which would explain different results for the course length.

I actually recommend when laying out a calibration course to choose a surface which is reasonably representative. In particular, avoid a surface which has had exretmely sharp stone chippings lightly rolled in to a thin sticky tar layer, which is often done here as a a quick fix to improve worn side roads. In my experince those sharp chippings play havoc with your calibration if you have a solid tyre or a tyre with a chunky tread like a mountain bike ( see the table I posted in the sixth post on page 1 of this thread)

A further practical application of the work is that it may lead some measurers, as it has me, to give up using solid tyres, and use a moderately wide pneumatic tyre (32mm) as I do. I made this change of my preferred measuring wheel over ten years ago, as a result of measurements reported in the above table. I did this despite the annoyingly large variation with temperature of the calibration constant of the pneumatic tyre when compared with the solid wheel. It is a trade-off and different measurers will have different preferences, not least of which may include what tyre they are comfortable riding with on their measuring bike.

Someone might argue that the table reports one person's experimental results, so of what relevance is all the theory in the thread? Certainly none at all for someone who does not consider the possibility of calibration constant variations on different surfaces. However, for those who do think about it its effect on results, the underlying theory, if we can work it out, may help predict what happens in different situations. However, for the moment we do not have a theory which works! Indeed this whole thread was triggered by a comment Jim made when he started his thread "Track portion of a road course" and asked
quote:
Also, I think the different friction coefficient for synthetic rubber vs. asphalt may be a factor.

Thoughts?
That triggered off myself, Mark and others to discuss the role of friction effects on the calibration constant.

Duane: I think you have got the magnitude about ten times too small in your post. It is not 10 cm per km, it is in the range from about 20 cm per km increasing to 200 cm per km in some tyre/surface combinations. The possibility of 100 cm per km is a big worry for everyone since this is the whole of the SCPF used up, with nothing left to cover other measurement errors.

A second point arises from your observation that a solid tyre ridden straight from storage has a higher constant over the first few 100 m. I have experienced exactly the same effect with a Suretrack solid tyre. Although in my case I found it was not due to temperature or the tyre warming up. What appeared to me to be happening was that when ridden tyre gets a temporary compression which it retains for a considerable time (ie for breaks during the course of a measurement and until one gets back home for the recalibration) However if I left the tyre over night and then carried it to the calibration course before fitting it to the bike I would see exactly change you see over the first ride or two as the tyre assumes its compressed state again. The temperature change of my solid tyre to give several counts change would have been very very large to give 0.1% change of calibration constant. I convinced myself it was not internal heat generation.

Mark: I agree with you on the role of evaporative cooling. It does take place, and the count increases. I have seen it when riding many calibrations on my Copenhagen Drive calibration course. I used the wet bulb temperature measured with a whirling hygrometer and found some correlation when the tyre surface was thoroughly wet. I have also been caught out in a short rain shower during real measurements and the course length appears to become longer as the calibration constant increases.

Pete: You kindly started this thread when I was worried that we had rather gone off the topic of the previous thread - thank you. I don't know whether it is possible to edit the thread title once it has been established. If it is, it might be worth putting some sort of warning in the title - I am not sure what, but I would hate to think people are struggling to read through it all and are uncertain what it means for them - or for anyone else for that matter.

Library Visit: Today I looked at four books on tyres in the library. What I read there confirmed that our theory for the measuring wheel is correct. Over the next day or so I will try and write up a separate post summarising what I found.

For now I want to recommend measurers interested in simple physics of the bicycle to get hold of a copy of "Bicycling Science 3rd edition, by David Gordon Wilson, MIT Press 2004, ISBN 0-262-73154-1 It is a really excellent book which I wish I had seen years ago. The science is explained without an excessive amount of mathematics so most should find it easy to follow. It has some really good section on the historical developments, which I found very interesting. Dont buy the first edition pub.in 1974, make sure you get the 3rd edition (2004) which has a big section on bicycle physics, by Jim Papadopoulous. I have just ordered my copy on www.abebooks.com for about $20
While Mike and Mark buried me with some of their technical discussion, I took in enough to be more interested in the relationship between the tire and the road. Today, I was able to speak with a transportation engineer that is involved in pavement testing and research. While some of this might be only distantly related to the existing discussion, I found it interesting enough to share.

Regarding pavement friction, he said that police agencies often used a crescent shaped portion of a tire that is filled with concrete and pulled with a scale in order to calculate a friction coefficient. For road and runway tests, transportation engineers use ‘dynamic friction trailers’. The tests typically involve wetting the road surface and locking a tire on the trailer that is rigged to measure torque. This test can also be done on a dry road. Some different trailers and links to short ‘in action’ videos can be seen here:
http://www.dynatest.com/hardware/frictionentrance.htm
Might there be a way that we can measure torque with a bicycle tire on multiple surfaces? Would this provide and value in discovering rolling resistance? Who has a dynamometer lying around their garage that they’ve been waiting to use?!

We also talked a bit about heat. I’ve always considered that our warm-up riding allowed time for the tire to acclimate with the air temp and road temp. I had not considered that heat is also produced from the deformation of the tire.

Lastly, we discussed ‘macro texture’ and tire texture and how the two combine to allow water to escape. This is primarily a safety related area of study. He then mentioned ‘micro texture’ and how rubber slides across stone. This caught my interest. He described that the type of stone used in either concrete or asphalt/bituminous plays a significant part in friction over time. Each type of stone provides a different level of friction initially and also polishes at different rates over time. So, a new smooth road may provide more friction than an older road that provides a rougher ride but has highly polished surface stones. And – our little bicycle tires will not deform the same way on a smooth surface as they will on a rougher road that is pitted or has many protruding stones.

Because a great variety of surfaces are tested, there is a standardized testing tire used in the transportation/road building industry. Without a standard bike and tire for each of us, I don’t know that measurers can address any variability that is the result of the rolling tire and the surface on which it rolls.
quote:
Regarding pavement friction, he said that police agencies often used a crescent shaped portion of a tire that is filled with concrete and pulled with a scale in order to calculate a friction coefficient.

I did a similar thing to try to measure friction . I looped a zip tie around my front wheel and then pulled on it with my fish scale (that I use to get measuring tape tension) with just the weight of the bike. I got the same values of pull force for the asphalt and concrete in front of my house. It was pretty crude so I'm not sure I would conclude the friction coefficients were the same.
quote:
Might there be a way that we can measure torque with a bicycle tire on multiple surfaces? Would this provide and value in discovering rolling resistance? Who has a dynamometer lying around their garage that they’ve been waiting to use?!

I believe rolling resistance is due to energy loss in the tire. Compressing the tire in the contact patch requires energy. The amount of that energy that is not returned when the tire is uncompressed determines the rolling resistance. So the rolling resistance depends a lot on the deformation behavior of the tire, and not as much on the friction coefficient.
Rick: It is very useful to get comments from an expert, and it may direct us towards understanding the things that affect our measuring wheels. However, I agree with your instinct that the reason we ride around is to ensure that the tyre is at the air and road temperature, not in order to let the rolling resistance warm it up. I think its much more the air temperature rather than the road temperature which is important because when we ride at 10 mph in still air, the heat transfer of the 20 mph wind at the top of the tyre tailing off to 0 mph at ground level, dominates the heat exchange between the tyre and the surroundings.

On the issue of rolling resistance, I have not tried to measured it as Mark has done, but several books I have consulted over the past few days report a value for Cr, the Coefficient of Rolling Resistance, of about 1% or a little lower for bike tyres.

If I have a load on my front wheel of 50 lbs force, I calculate a force of about 0.5 lbf required to overcome the rolling friction of the front wheel. So at 10 mph this will correspond to about 10 watts of heating in the tyre from the energy loss as described by Mark in his post above. My tyre has a surface area of roughly 0.1 sq m - more than enough to lose 10 watts with a 0 to 20 mph airflow over it - with only a tiny temperature rise.

n.b. car tyres do heat up noticeably - you can feel them warm after driving at 50 mph - but for a car we have a load of perhaps 500lbs. Cr perhaps nearer 2% in some cases, and 5 times the speed, So that scales 10 watts for the bike front wheel up to 1KW for a car tyre.

I find that we, who are interested in our measuring wheels, can easily be misled in all sorts of ways by those who quote at us what happens in car tyres, especially car tyres driven round corners at high speeds, losing grip, and skidding off the road. I think that measurements of the coefficient of friction - either the maximum for no skidding, or the sliding coefficient are of little relevance to what is happening as our bike wheel rolls along the road without any skidding. The guys who are measuring road friction are measuring it to determine how easy it will be for fast cars to skid. That said I still don't rule out the possibility that our experimental observation that our calibration constant varies with surface roughness, could, in some way, be connected to the value of the coefficient of friction in a narrow region at the edge of the contact patch. On the other hand it may not be the friction but the geometry of the surface which causes the calibration variation. We don't know. At present we do not have theoretical explanation of this variation of calibration with surface roughness. I hope this thread will encourage people to find an explanation.
Mark: I read your post without enough care.

I would expect the coefficient of sliding friction to come out around 0.5 to 0.7, judging by what I have read in various places.

Different sources give different values for the coefficient of rolling resistance. Most sources agree with you that its value is determined mostly by the "resilience" of the tyre, or more precisely the fraction of the energy of compression which is returned when the compressed tyre leaves the contact patch. It seems that as well as the role played by basic deformation into the contact patch shape, the large scale roughness of the road on a scale of several cms and more makes a contribution to the rolling resistance. If the road surface gives (ie soft ground - or even a rubber athletics track) then the ground deformation will also contribute to the rolling resistance. The medium & micro-structure of the road surface, say 1 cm and less, is said by some not to be very important, However, others suggest that ordinary sliding friction may play small part here and so contribute to the rolling resistance. One source shows quite a variation of rolling resistance on different surfaces, somewhat at odds with what is suggested in the book Bicycling Science by David Gordon Wilson, which has arrived and which I have been studying further today. Wilson says:
quote:
It is possible that the tire tread continually undergoes a slight slippage or rubbing (for example, where it lifts away from the road at the tail of the contact patch). This seems a reasonable explanation of the tread wear that takes place as tires are ridden, but we have no analytical model for it.

I would be quite interested in accurately measuring the rolling resistance on different surfaces and see if it correlates at all with the change in calibration constant. Your fish scale is a good idea, but it would be best to have the bike loaded and travelling at some fixed speed, so it may be a two man job. I will start experimenting by getting someone to pull me along tomorrow, just to see if I get any sort of reading for back wheel + front wheel. Perhaps we will need a specially attached loaded trailing wheel to do accurate experiments somewhat along the lines of the skid trailers sometimes towed by engineers measuring skid resistance etc of road surfaces.
This will be detailed so here is a summary:
  • I have measured the rolling resistance of my bike using a spring scale while being pulled along by a pedestrian. The reading on the scale is between 300 and 500 grams.
  • I wondered whether rolling resistance would change calibration constant, so I rode my calibration course with the front brake partly applied. The calibration constant reduced by 0.14%. That means the tyre effectively got larger.
  • I was curious about whether the sign of the tyre change would be predicted by the pneumatic tyre "slip" theory. The theory does indeed predict a decrease in calibration constant under braking
  • All this will only be of interest to those who wish to understand what is happening in their measuring wheels. For practical purposes a measurer can ignore the details of this post, because all measures already know (or should know) that one should never use the front brake to any appreciable extent when riding along measuring.

Experiment to measure the rolling resistance for my bike

An assistant at walking pace on a level road pulled me along on my bike holding a spring scale attached with a rope to my bike. With practice he was able to maintain a steady reading of between 300 gm and 400 gm and constant forward speed. I conclude the coefficient rolling resistance, Crr, of the bike (two wheels laden with say 70kg) is 0.35/70 = 0.005.

In a second experiment with a different assistant, we attached the spring scale to the bike so I could take the reading while being pulled. Even though the assistant attempted to pull steadily, without the visual feedback of the spring reading, the scale readings fluctuated much more - perhaps partly because I was looking at the scale rather than keeping my head up and concentrating on balancing the bike. The readings seemed somewhat higher perhaps averaging around 500 gms with peaks of 1 kg. This experiment suggests a higher Crr around 0.007.

The values between 0.005 and 0.007 for Crr are not unreasonable for a 32mm tyre pumped to around 70psi. See the Analytic Cycling website

Incidentally, I strongly recommend that anyone interested in a simple online calculator of bicycling forces should try out the forms on this website, which include the forces of air resistance and slope, and calculate ones power output at different speeds. See home page

While it is nice to get a direct measurement of the rough magnitude of Crr for my bike, the method as I have implemented it is not really good enough to compare rolling resistance on different surfaces. Most of what I have read suggest the Crr does not vary much with microstructure or roughness in the road surface and only a little when at the slow speeds which measurers employ. The dominant effects are the compression into the contact patch, and any longer scale roughness in the road surface. There seems to be some mistake in a table given in the calculator at www.analyticcycling.com ie
quote:
Wooden Track 0.001
Smooth Concrete 0.002
Asphalt Road 0.004
Rough but Paved Road 0.008

I cant see why a wooden track or smooth concrete should be so low. I think this table is a mistake. However it does not seem to be automatically used in the calculations. You enter a value for the Crr which you can choose.

Experiment to determine how the rolling resistance or a braking force changes the calibration constant

Many years ago I noticed very odd results for the calibration constant when I had a front wheel bearing failure during calibration rides. The front wheel had become stiff to turn although I could still ride. On dismantling the bearing I found that two ball bearings were no longer a nice spherical shape. I was able to restore the wheel with new balls, and then got normal calibrations. At the time I did not understand the calibration changes that occurred as the turning resistance of the wheel increased on successive calibration rides. Unfortunately just at the moment I can't find the 12 year old notebook with my readings, so I decided to carry out a new experiment to check the effect.

This time instead of relying on the unexpected occurence of the stiffening of the bearing, I decided to apply a braking resistance by partly applying the front wheel brake. With a little practice, I found that the right amount of partial squeeze of the front brake lever which increased the force I had to apply in pedaling. Here are my results:
Cal course length =	695.254	m				
						
Normal riding for measuring	start	end	difference  cal const    av. const	
Ride 1  E to W                     3848.5   11471.4   7622.9      10975.2		
Ride 2 W to E                    11471.4   19096.3   7624.9      10978.0       10976.6	
						
Brake partly applied to front wheel						
Ride 1  E to W                   19096.3   26707.8   7611.5      10958.7		
Ride 2 W to E                    26707.8   34322.8   7615.0      10963.8       10961.3	

So  [B]increase[/B] in effective rolling radius when brake partly applied = 0.14%

It was all rather uncalibrated but I tried to keep the braking force, as sensed by pedaling difficulty, constant. I definitely tired a bit during the two rides I did of my 695.254 m calibration course. I think I probably applied the brake a little less hard during Ride 2 which would explain the somewhat smaller difference from normal riding which I observed on Ride 2. Although the experiment was intended only as a qualitative check of the sign of the effect, I can make a very crude estimate of the braking force on the bike. Since pedaling was quite hard in top gear I guess it might be equivalent to pedaling up a 3% slope. With a weight of say 70Kg, a 3% slope implies a force of 2Kg. This should be compared with the values I obtained for the normal rolling resistance of the bike of 0.35 to 0.6Kg. However the experiment to measure this force involved the rolling resistance equal to the sum of the front wheel and rear wheel. Assuming that these are in proportion to the weight on the wheel, the front:rear ratio will be 1:2. So in the normal rolling resistance when I measured 0.35 to 0.5 kg. Only one third of this would be coming from the front wheel, ie 0.1 to 0.2 Kg. I therefore think that very roughly when I applied my brake to the front wheel and measured a decrease of calibration constant of 0.14%, this corresponds roughly to a 10 to 20 fold increase in the normal rolling resistance.

Explanation of the sign of the effect

Amazingly (and reassuringly) the sign of this effect fits the general slip theory of the pneumatic tyres as applied to motor bicycles and other motor vehicles.

Slip in this context, does not necessarily mean the sliding of the wheel along the road, either in part of the contact patch or in the whole of the contact patch (a skid). The following sketch shows the linear region in which the measuring bike wheel operates:


I think I can see how the linear region of the above slip graph can be derived using a brush model for the tyre tread. It should explain in detail how under braking the effective rolling radius increases because of the different compression of the tread under braking. I will attempt to do this later.

In a second picture, I have summarised the derivation of the effective rolling radius for the freely rolling wheel. This follows my derivation in 1998, but does not require the tyre to be a thin elastic membrane. All pneumatic tyres, including motor bike and car tyres, will behave like this. I also show a simple derivation from the standard slip theory that when a measuring wheel is braked the calibration constant will fall. This agrees with my new observations, reported above.


Implications of these experiments for measurers

Don't brake your front wheel when measuring, especially when descending long hills, which could introduce significant errors by changing the calibration constant. Well we knew that anyway, but it is nice to have the effect directly measured for the first time as far as I am aware.
Confirmation of sign slip effect on calibration constant for the rear bicycle wheel
In the last post above, I showed that when you slightly brake the front wheel its calibration constant decreases, by about 0.14% for my bike with a braking on the bike estimated as around 2Kg.

I explained this by the slip theory of pneumatic tyres. I emphasised that wheel slip in this context does not mean that the tyre is sliding across the road in the contact patch. Slip in the context of this theory means that the tyre is being distorted (compressed) as it passes through the contact patch region and the effect for the braked front wheel is that the effective rolling radius is increased, and the tyred wheel is turning slower than it would normally be for that bike speed.

If one looks at the figure in the previous post you will see that the sign of the effect is opposite for a driving wheel, such as the bicycle's rear wheel. To provide a larger driving force the slip is +ve. This means that the effective rolling radius is reduced, and the calibration constant of the rear wheel will be increased.

Yesterday I carried out an experiment to see if this happens in practice. I fitted a JO counter to my rear wheel, and rode a calibration course several times, first normally, then with the FRONT brake partially applied as before. I took a final ride normally, with no braking, to check that calibration constants then return to the initial values.

The average decrease in front wheel calibration constant was 0.10%. Similar to the previous post and showing I was braking slightly less strongly.

At the same time, the rear wheel showed an increase of calibration constant by 0.06%. This is exactly sign of effect predicted by the figure above.

This confirms that the slip theory produces the correct sign of effect for both a braked wheel and a driven wheel.

This observation will be of no interest to those measurers not interested in tyre theory. They already know, or should know, that they should not attach their counter to the rear wheel which imparts variable driving forces to the road as the rider pedals with varying force to overcome wind, slope etc. and is subject to accompanying changes in calibration constant.
It's time to rethink.

I heard from a measurer recently. He had completed the measurement of a 20 km course, a substantial part of which was on a dirt path. He used a paved calibration course.

When he submitted the data he was told that he needed to lay out a cal course on the dirt portion of the course. He did so, and did comparison calibrations on both cal courses, which were 15 minutes apart. He got a calibration difference of one count per km.

It seems to me that we need to rethink the idea of requiring that the cal course be on the dirt path. It adds extra work, and the resultant cal course is generally only temporary, as nails can't be used. Also, we are willing to accept the variation we can get with non-dirt types of pavement, so why not accept the difference between dirt and pavement?

I believe that this requirement (if it is indeed a requirement) is unnecessary and unkind. The SCPF will generally cover the difference, as the difference is generally small.
I have experienced much greater differences than one click per km. 4 years ago, I rode the same distance on a concrete path, then a cinder path next to it. I rode both 4 times, and, if I recall, I got over a 1% difference.

What I believe should be revisited is, what other measurers are experiencing. Just as I don't expect everyone to accept my observations, I am not inclined to accept 1 click per km difference between pavement and dirt. I'd like to see more data from other people, also.
I agree with Pete. Let's allow calibrating on smooth hard surface while measuring on rougher surface.

I've been looking for a post from a few years ago, where I gave some details of a measurement on the C&O Canal. (Can someone explain how to do a search on this site?) The thrust of the posting was this: I calibrated on smooth road then on the canal, then I measured the course and reversed the process, calibrating on the canal and then on the road. I was happy to have the canal cal course especially because it was right next to the course in question but also because my counts/km were lower when calibrating on the canal.

Had I calibrated on the road only, the course would not have been short-- just a little too long for my taste, but not a lot of difference either way. (Well I'll say that now until I see what I said before!). So we should let that happen I think, but still allow someone to lay out a cal course on whatever surface they are using if they choose.

What we should be very wary of, on the other hand, is calibrating on a rough surface (including rough asphalt or concrete) when measuring a smooth-surface course.

For anyone who missed it, read Mike Sandford's brilliant research and reporting on this topic (how long ago? I will leave this to someone else!)
I couldn't agree more with Pete, based on a measurement a couple weeks ago where a .6-mi section is on a gravel path. We layed out a temporary 3000-ft calibration course on the gravel path. This was the longest straight section of the path. The gravel cal data as well as the road cal data are below (I hope the alignment of the columns comes out OK).

Cal 1: 5/2/2013: 9:21AM : Mercier Ave; 60 deg
PJV DAZ
196315 221066
199686.5 3371.5 224570 3504
203059.5 3373 228074 3504
206431 3371.5 231577 3503
209803 3372 235081 3504
3372 3503.75
17821.96416 18518.2998

Cal 1: Dirt; 5/2/2013: 10:30AM : Rockwell Park; 70 deg
PJV DAZ
236725 262473
237733 1008 263523 1050
238742 1009 264574 1051
239751 1009 265624 1050
240761 1010 266674 1050
1009 1050.25 17776.1584 18502.8844

Since the road cal was greater, we (with the certifier's approval) used the road cal for the entire course. We did only one set of 4 rides of the gravel cal course to verify that the gravel constant was smaller.

We have another course to measure where about 1-mi of a 5-mi course is on dirt roads. I plan the same process, verify that the dirt constant is smaller than the dirt constant then use the road constant.

Pete is right, determining a dirt constant is time consuming and won't help prevent short courses. I also think (unscientifically) that it has negligible impact on overall course length accuracy.

I remember Mike Sanford and others did some extensive study of the impact of road surface roughness calibration constant. Maybe there is scientific verification of my feelings.

It would be helpful to come to some kind of agreement or process or understanding regarding these non-paved sections. That would probably help those measurers who ignore these sections and neither show them on maps, mention them to certifiers or take the extra time to do some sort of dirt (dirty?) calibration.
I am not trying to keep from getting short courses, when I comment on the difference between hard and soft surfaces, since we normally calibrate on hard surfaces.

I am more interested in calibrating on pavement, then measuring a course where more than half the course is on gravel/cinder/dirt.

As shown in an earlier thread, I got a 1% difference when I measured concrete and cinder trails, which were next to each other. This 1% yields a 5k course that is 50 meters longer than it should be, if the entire course was no gravel, but calibrated on pavement.

A Half-marathon course with 50% gravel would yield a course that is 105 meters long. That is a material amount, in my book.

I will try to do more comparisons, by finding pavement next to cinder or gravel trails, and ride at least a quarter-mile in a straight line. If others can to that, also, we can compare results.

Add Reply

Post
×
×
×
×
Link copied to your clipboard.
×