
Recently, Google Earth added the ability to create elevation profiles far a selected path. This will come in very handy when trying to locate the start, finish, highest and lowest elevation for the measurement certificate.

Here's a sample from a recent 5K measurement.


Google Earth is a free application that you can download from the Internet.

Enjoy. -- Justin
Original Post

Replies sorted oldest to newest

MapMyRun.com has had the elevation profile capability from the beginning, along with the ability to edit the course, once saved.

The big caution about these is that the profiles are generated from topo maps, and normally don't reflect man-made elevation changes. For example, I mapped a course across a dam (the tops are pretty darn flat), yet the profile showed the original gulch topography. Similarly, if lots of ground has been moved (to lower or raise for leveling purposes), that may not be reflected, either.

These are good tools, but, just like GPS, are to be viewed with an open mind. In Justin's example, note the dips/spikes. These may be gulches that have been bridged or filled-in. Justin - are those dips/spikes actually in the course? Just curious.
I'm using Google Earth with Windows XP. I can't seem to find the profile-generation tool anywhere on my copy of Google Earth. Is there some special trick? I am using the standard, free version of Google Earth, not Google Earth Pro.

In the past I've just recorded elevations as I measure the course, then used Excel to make a profile.

I'm at a standstill. Anybody got a hint?
Pete,

You will need version 5.2.1.1588. Click on Help>About Google Earth to see what version you are running. In the same Help menu you can check for updates online.

Then after you create a path right click on it and select properties and then the show elevation profile.

Another HUGE feature they have added is showing the distance of a saved path. They have always had a measurement tool, but you were never able to save a measurement that you made. The measurement tool is great because you can move intermediate points around or delete them, but not being able to save the measurement was a big problem that has been around for years. They have finally eliminated this problem by showing the distance of a path. I have checked this path distance and it appears to be the same as what you get with the measurement tool following the same path.

Thanks Justin for bringing this to our attention. I probably wouldn't have updated for a while if you hadn't posted.
Thanks for the tip, Mark. I’ve now got the proper version of Google Earth, and the profile thing does seem to work.


Above is the profile a 5k I recently measured. It’s just a local race, and I expect a lot of the folks are going to get a bit out of puff in that last mile.

I wonder if there is a way to export the data on which the profile is based, so that it can be used in Excel, so as to produce a profile format more to my liking. Food for further investigation
Last edited by peteriegel
If you do your mapping in MapMyRun.com, you can open an existing map (create one, then save it), then save the course as a GPX file. Then, go to http://www.gpsvisualizer.com/, and upload the GPX file, choosing "plain text file" as the output.

Copy the output, and paste into Excel. You will have to remove some rows, but then "Convert text to columns". From there, you can make your graph, showing elevation. (Elevations are in meters in the text file, so if you want to convert to feet, do that prior to making the graph.)

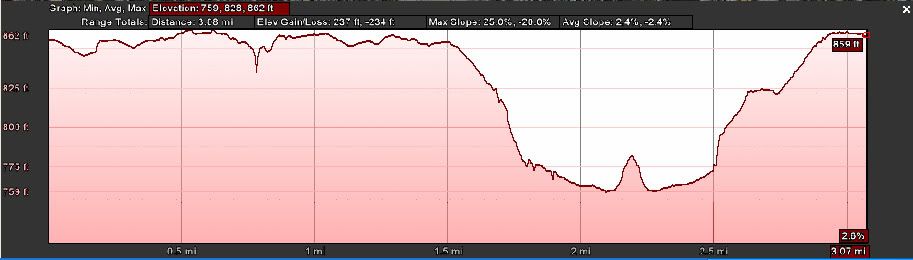
Or, if you use a cheap Paint program, you can tell either GoogleEarth or MapMyRun to show the elevation profile, capture your screen image, paste into the Paint program (sorry, I use Photoshop), and select/copy the profile. Paste that into your map that you are creating, and you will have it.

Convoluted, but if you are trying to do this on-the-cheap, this way works.
Mark, I once actually did take elevations as I measured. My instrument was an electronic speedometer, "Avocet Altimeter 50," that had an altimeter function.

Without going into further detail I'll just say that it didn't work out. I may still have data from long ago when I did the measuring. I'll root around and see what I find.
Here is a page from Measurement News, March 1997:


Supplementary information:

Start elevation by Google Earth = 809 feet
Finish elevation by Google Earth = 745 feet

Certificate start elevation = 790
Certificate finish elevation = 750

Obviously I got my elevations in error. I have a complete set of Ohio USGS maps, but did not have anything for Indiana at the time. Now, of course, we have Google Earth and online access to USGS maps.
Last edited by peteriegel
Thanks to Duane Russel for reminding me about GPS Visualizer. I put together the steps that you can use to create a text listing of the altitudes from Google Earth. The process is nearly identical for generating elevation profiles from GPX files, TXT files, and from GPS units.

1) In Google Earth, save the selected path as a KML or KMZ file.

2) Go to http://www.gpsvisualizer.com/convert_input

3) Select Output format as Plain text.


4) Choose the file your created in Google Earth.

5) Set the Add DEM elevation data to: From best available source.

6) Press the Convert button.

It will create a text file the contains latitude, longitude, and altitude that you can copy and paste into your Excel program.


Hope this helps. -- Justin
Here’s a comparison of the two ways of getting the profile.


The top image is gotten from Justin’s instructions, and was created in Excel from the elevation data generated by saving the kmz file.

The lower image is the instant profile generated onscreen by Google Earth.

There are two anomalies: In the early part of the course, just before and after 1 km (scale of upper graph) there is a sharp rise in the profile, in the upper graph.

In the lower graph there is a small but noticeable decline at about km 1.2.

From riding the course I do not recall that either sharp elevation change exists.

With Justin’s approach I can edit out the offending points, and produce a profile that better fits my idea of the reality of the course.
Last edited by peteriegel
Hi guys, this thread is quite old now, but it fits well into my question.
I would like to know how Google Earth altitude information is measured. To make it clearer: I would like to know where this information comes from, how the satellites measure it. I presume that the altitude in Google Earth is derived from the satellite data.
The reason why I ask ist that I tried to profile a piece of land with a lot of high trees. I knew that there should be a creek with steep slopes on both sides because I had climbed down to the creek and then back up again, but I could not locate the creek with Google earth. Any of the various routes that I drew across the supposed position of the creek shows a rather gentle altitude profile with no sudden hole. The slope appears to be not more than 10-15%, the same slope as the road to our house that I walk up and down every day woithout any problem. But the slopes on both sides of the creek were so steep and high that we had do go down in serpentines and then had to search a while along the creek to find a place where to climb back up without too much difficulty. Nothing of this is shown in Google Earth profiles. But I noticed that all around the creek there were very high trees, about 60 to 100 feet high, while on the higher parts the trees were not so high. This leads me to the conclusion that the altitude information is gained with optical methods so the tree tops of the forest appear to replace the ground.
Can anybody confirm or correct this thought?
Can anybody explain how the altitude information in Google Earth is generated? I have created various routes over a forest area where there is indeed a creek about 50-60 ft lower than the plain nearby, with very steep slopes on both sides that make it very difficult to get to the creek and then back to the upper level. I have been down there, so I know it. But the altitude profiles created with Google Earth don't show such a hole, they show a steady slope of about 10-15%, just like the road leading to our hose which I am walking every day without any problem.
I noticed that the tree tops in the creek area were much higher than elsewhere and had nearly the same altidude as the higher surroundings. This makes me think that the altitude information is created from optical data from the tree tops and not from the real ground.
Or do these data have such a low resolution that a 40 m wide hole does not create a bump in the profile? The length of the profiles is around 250 m (750 ft).
Can anyone enlighten me?
Thank you for the hint. Your quote didn't really help me understand anything, but there is a better quote on Wikipedia:
"Errors sometimes occur due to the technology used to measure the height of terrain; for example, tall buildings in Adelaide, Australia, cause one part of the city to be rendered as a small mountain, when it is in fact flat. Also, in Downtown Los Angeles, there is a large hill in the approximate location of Bunker Hill, where many of the skyscrapers are located. The height of the Eiffel Tower creates a similar effect in the rendering of Paris. Also, prior to the release of version 5.0 in February 2009, elevations below sea level were presented as sea level, for example: Salton City, California; Death Valley; and the Dead Sea were all listed as 0 m when Salton City is −38 m, Death Valley −86 m, and the Dead Sea −420 m.

Where no 3 arc second digital elevation data was available, the three dimensional images covering some areas of high relief are not at all accurate, but most mountain areas are now well mapped. The underlying digital elevation model has been placed 3 arc seconds too far north and up to 3 arc seconds too far west. This means that some steep mountain ridges incorrectly appear to have shadows extending over onto their south facing sides. Some high resolution images have also been misplaced: an example is the image covering Annapurna, which is misplaced by about 12 arc seconds. Elevation data was recently[when?] updated to 10-meter (1/3-arc-second) resolution for much of the United States from the previous 30-meter (1-arc-second) resolution."
The problem is obviously resolution. If resolution in some areas is 3 arc-seconds (90 meter) or worse then it's obvious that a 1 arc-second (30 m) wide creek simply disappears and that elevation changes in this range get averaged out.
With apologies if this old news: Three things I did not see mentioned in this thread about GE.

After you make a GE Path plot and save it, you can put the little hand over the path (now in red), right click, select Elevation... and when it shows the elevation profile, move the cursor down on the elevation profile. This will put an arrow on the path above somewhere. By moving the hand across the profile at the bottom of the screen, the arrow moves on the map and you can tell where the mile marks should come out. (Kind of because of tire expansion and 1.001) Quite handy when planning a ride.

If you right click the plot and select Properties, you can immediately adjust all the points. You have to be careful not to click and drag or you get spurious lines you have to erase. This means going to the compass arrows at the right side of the screen to adjust the view.

Also you can save the file as a .kmz and send it to people with GE and they can adjust points themselves. I like this because it is much, much fast than GMapsPedometer for making adjustments. But you can't relax or you will have red lines all over your map!

Oscar
Oscar that's a nice trick to use the elevation profile to also get intermediate distances along a path in GE.
When measuring a course I create waypoints at the mile marks and then upload them to GE when I get home. I then measure between the mile marks in GE to make sure it is actually a mile just as a sanity check. But using the elevation profile to do that is a lot faster. Thanks.

"Also you can save the file as a .kmz and send it to people with GE and they can adjust points themselves."

Yes that's a great feature with GE, especially since those kmz or kml files are only about 5kb. But in 10 years of measuring I don't think I've encountered a race director that has ever used GE. When I need to send them a course I either have to take a screen shot, or output to kml, convert to gpx, and then read it into mapmyrun and share it with them.
I've found quite a few RD's do have GE, and then a lot who don't as Mark says. I think this is one more place where we put on our teaching hat-- it is such a useful tool that everyone should have it and especially RD's.

I've not tried to modify an elevation profile but thanks for the tip, Oscar! This sounds analagous to clicking on "get information" for a waypoint-- that will allow you to nudge the waypoint into the right place as well as rename the point.
Instead of sending the RD a Google Earth file, I send a html file(s) created in GPS Visualizer .
This can include not only the route but the Start, Finish, splits, etc.

Every once in a while, I have someone indicate that they can't open the HTML file, so I load the file to my domain.
Choctaw Nation 15K


I ask the RD to very closely review the exactly route I plan to measure so that the RD can confirm before I do the actual measurement.
Ken, I knew that GPS Visualizer could read your data and show you the map. I was not aware it would create an HTML file of the map. Thanks!

Bob, I have convinced a couple RDs to use google earth, but in general I've found people are reluctant to install new programs on their PCs. It's much easier to convince them to use mapmyrun.
Bob,

The HTML page made available by GPS Visualizer that comes up when you click on "view" is only available temporarily.

You will need to "download" the HTML file then email that HTML file. I find that most everyone can open the HTML file.
Once opened, they can changes settings such as switching from map view to aerial view and zoom in-out.
For those few who are not able to open and view the HTML, I load the HTML file to my website and provide them a link.

Hope that helps...

Add Reply

Post
×
×
×
×
Link copied to your clipboard.
×