Sometimes it is difficult to find a road that has a 300m, flat, straight section that can be used for a calibration course. Especially the flat part.

Pete suggests that riding downhill causes less weight on the front wheel, while the opposite is true for riding uphill. This would mean that riding in the downhill direction on a cal course would give more counts than riding uphill on the same course, and this has, in fact, been observed.

What has not been observed, or proven, is the idea that if you do an equal number of uphill and downhill rides on a cal course, this hill effect will cancel out, and you will get the same cal constant as you would on a flat course.

I decided this was worth testing. I have a cal course in front of my house that is 400m. The 200m on the west end has an elevation change of about 4m. The 200m on the east end has an elevation change of about 1.5m. I rode a total of 16 rides (8 out and 8 back) on each of the two 200m sections.

Here's the results


After I completed the experiment I realized that the pressure in my tire, 50psi, was on the low end. On another day I repeated the experiment with a higher pressure of about 63psi (the recommended pressure for my mountain bike tire is 35-65psi).

Here's the results from that second test.


The first thing we can observe is that downhill rides do result in higher counts than uphill rides, as expected. This was true for the hilly 200m section, but was also true for the "flat" 200m section, as the return direction on this course was downhill (by 1.5m) and gave a higher count than the uphill direction.

The second, and much more surprising finding, is that the uphill and downhill effects do not appear to cancel themselves out. In both experiments (lower pressure and higher pressure) the average cal constant on the hilly course was about 10counts/km lower than the average cal constant for the "flat" course. This is a huge difference of nearly the entire SCPF!

This experiment, along with the previous one on cal course length, suggests that you will get a more accurate cal constant by using a short, flat cal course than you will using a long, hilly one.
Original Post

Replies sorted oldest to newest

I'm retaining some skepticism. The difference seems to be enormous - more than I'd expect. It uses up almost the entire SCPF.

One explanation could be that the halfway point used was off from where it should have been . Up and down averages in both directions would balance out if the halfway point was off by 3 inches, with one half being 199.92 m and the other 200.08 meters. How was the halfway point established?

Also, pavement quality could have had an effect, as could a difference in riding posture.
Pete,

I'm retaining some skepticism myself as this is only one piece of evidence from one rider. However, as far as I know this is the first time anyone has done an experiment of this type.

To address your questions:

1) The original certified cal course is actually 1309.98 feet. I remeasured it a couple weeks ago in order to run this experiment and lengthened it to 400 meters. I have discovered recently that when I thought I was applying 10lbf I was actually pulling a good bit more, so in all my cal course measurements, including this one, I now use a little clamp I attach to the tape and a fish scale I hook onto that to make sure the force is 10lb. When I remeasured it I put P-K nails at every hundred meters along with small white spray paint lines. When I saw the results of the experiment I became concerned, so I went out this morning when it was about 68 degrees and measured it again. On this measurement I found the hilly 200m to be 200.005m and the flat 200m to be 199.995m.

2) I tried to keep my riding posture the same on the hilly course and the flat course, but there is some unavoidable shift of weight on the different rides. I think that's what we're measuring here though.

3) The riding surface on the two courses is different. The flat course is entirely recently-resurfaced asphalt while the hilly course is almost entirely concrete. Both are in good shape with no potholes and few cracks. It's certainly possible that this is causing some of the difference I'm seeing, but if the change between asphalt and concrete is the reason for all the difference, that would be its own cause for concern.

I should mention that I used randomly placed pieces of tape as the end/start points of my rides, so I had no idea what the numbers meant as I was taking measurements. This is described in my post about the length experiment I did. Also, I used a marked-up wheel to record wheel revolutions rather than Jones counts.

I would love for someone to repeat this experiment, but it might be difficult to find the right spot. Finding a 200m section of flat road right next to a hill is not as easy as you might think. Google Earth is a great way to look for such a location, however. I was lucky that I had something pretty close to what I needed right in front of my house.
I have got such a hill a mile from my house. Paving is entirely asphalt. I may tape out a couple of 200 meter stretches for testing. They will be separated by several hundred meters. The idea is to ride back and forth, capturing flat-free ride-downhill-uphill-free ride-flat for one measurement cycle, and repeat as energy permits.

I will use an electronic counter and split hairs on the rim readings

No promises at this point.
ANOTHER UPHILL-DOWNHILL EXPERIMENT


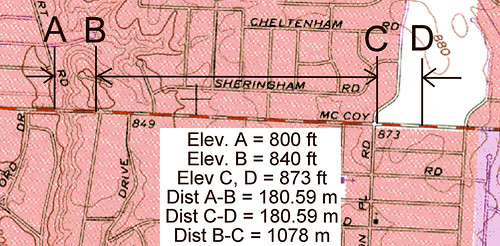
THESE ARE THE CALIBRATION COURSES I USED


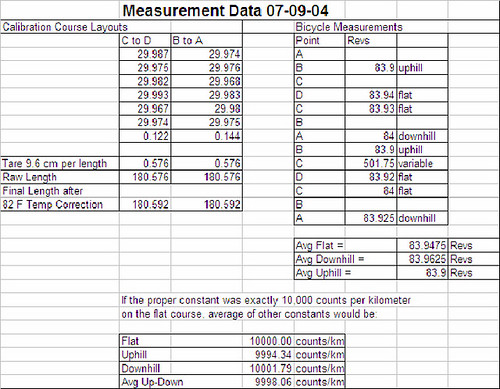
HERE IS MY MEASUREMENT DATA

I did a similar experiment to Mark’s today. I laid out two short calibration courses on McCoy Road, in northwest Columbus, striving to make them identical in length. I used the solo method, installing nails at each point and taping between them. Because my zero point is offset from the loop, I added 9.6 cm to each measured length. All taping was done in full sun, which did not vary during the exercise. Temperature was 81 to 84 F in the shade. One course was flat. The other was very hilly, having an elevation change of 40 feet over 180.59 meters, which is a titanic 67.5 m/km. It’s quite steep. The two calibration courses were separated by 1.08 km. The asphalt pavement was the same composition and age all along the route.

I rode from end to end twice in each direction, beginning at the west end. I used a Protégé cyclocomputer and counted wheel revolutions.

My front tire was pumped to 100 psi before the work began, and the rear to 80.

There appeared to be little wind present.

My data showed that there was very little error associated with using the average of uphill and downhill rides, even on such a ridiculously steep calibration course, amounting to only 0.2 m/km, well within our SCPF of 1 m/km.

I expect that further experiments, should they be done, will find results close to these. I believe the greater differences obtained by Mark to be caused by the two different pavement compositions.
Last edited by peteriegel
If we ignore the uphill/downhill aspects of my ride, we see that I had eight calibration rides over the 180.6 meter distance.

I normally calibrate on a flat 1000 feet, and almost always have a span of fewer than two counts for four rides. If my eight rides are converted to rides on 1000 feet we see the following counts (rounded to nearest count):

3347
3349
3348
3351
3347
3348
3351
3348

Above counts reflect use of a JO Counter with a ratio of 23.636363 counts per revolution.

If I saw these calibrations coming in an application I would think the riding was somewhat erratic but not terrible, and would likely not inquire as to the cause.
Pete,

I really don't think you have enough rides to make any conclusions. The reason is that there is way too much variation in your rides. If I'm calculating correctly, in your 2 downhill rides you see a variation of 10counts/km, and you see the same variation among your 4 flat rides. With such a small sample it is not possible to conclude that the difference between the two groups is 5 times smaller than the variation you see within the groups!
I must agree with Mark. When I did the work it was very hot on the road, and I sweated like a horse doing the solo taping. On the biking, I was not used to the calibration course. I generally do better riding on a familiar calibration course than on one which I have never ridden before.

One of these mornings, when it is cool, I will go out and do four rides each way, yielding four uphills, four downhills, and eight flats. Perhaps the data will be slightly better. Perhaps not. I have to use the tools I've got, which include my riding capabilities.

Now - how to assure that the calibration courses are the same length? I have no intention of remeasuring them.
Revolutions or Counts going Downhill as Compared with going Uphill

Introduction

Pete suggests that riding downhill causes less weight on the front wheel, while the opposite is true for riding uphill. This would mean that riding in the downhill direction on a cal course would give more counts than riding uphill on the same course, and this has, in fact, been observed.

Mark: in the above you misquoted Pete so I have made a correction below.

Pete suggests that riding uphill causes less weight on the front wheel, while the opposite is true for riding downhill. This would mean that riding in the downhill direction on a cal course would give more counts than riding uphill on the same course, and this has, in fact, been observed.

I was surprised at the above statement, because in a casual observation during a course measurement I found that I got fewer revolutions going down a long hill than when going up. I had assumed that this was caused by the tendency to lean forward and push harder on the pedals when going uphill, and so compress the front tire more.

Results

Last night I decided to check my previous observation on a very steep but straight hill, and repeatedly measured the revolutions following the white line on the edge of the road between two marks set 705 meters apart going down and up four times. The first three downhill rides were done at 20-25 mph and the last at 9-10 mph. The first three uphill rides were done at 7-9 mph while seated, and the last at 12-14 mph while standing on the pedals much of the time. Here are the results with all the downhill rides given odd numbers:

1. 337.97
2. 338.17
3. 338.04
4. 338.11
5. 338.02
6. 338.15
7. 338.00
8. 338.51

Downhill, there seems to be no significant difference between any of the rides and the average was 338.01. Evidently using a slower speed made no difference.

Uphill for the first three rides again there was no significant difference between any of them, but the average was 338.14 or plus 0.038% compared with that for the downhill rides, thus confirming my previous observation. The last ride, on which I stood up on the pedals much of the time, was much higher at 338.51 or plus 0.148%.

Differences found by Pete and Mark may have to do with riding posture and the fact Mark has a mountain bike.

Conclusions

1. A calibration course can have an appreciable slope without affecting its accuracy compared with that of a flat course. Uphill rides however should be taken slowly. This conclusion agrees with that of Pete but not with that of Mark.

2. Hills are better measured in the downward direction, but if measured uphill, they should be taken slowly without standing on the pedals.
quote:
1. A calibration course can have an appreciable slope without affecting its accuracy compared with that of a flat course. Uphill rides however should be taken slowly. This conclusion agrees with that of Pete but not with that of Mark.


Neville,

I'm not suggesting that downhill rides or uphill rides have more variance than flat rides.

I'm suggesting that averaging uphill and downhill cal rides will not give you the same cal constant as averaging flat cal rides. Your experiment did not test that possibility.

The fact that you got more counts (or revs) for uphill rides compared with downhill rides is surprising. Clearly, the effect of hills may differ from rider to rider.
No one, including me, is convinced yet that this hill effect is real.

But I think you should use a cal course that is the same "hilliness" as your race course if you can.
If the hill effect is real, you're accuracy will be better than if you used a flat cal course.
If the hill effect is not real, you're accuracy will be the same as if you used a flat cal course.
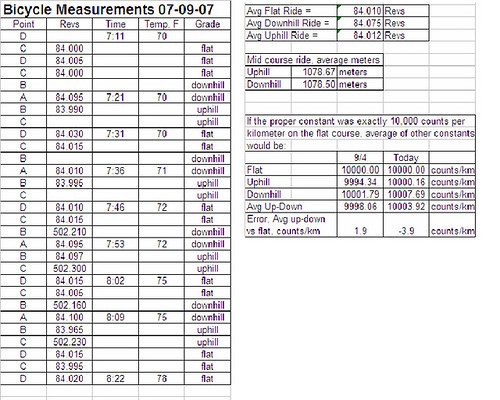
ANOTHER RIDE


Today I repeated my rides of September 4, trying to be steadier on the very steep portions. I’m not sure I succeeded. The riding on the section A-B has a lot of variation. On the uphill I am in a very low gear, pedaling fast to maintain slow progress and trying not to wobble. On the downhill I am coasting while riding the rear brake.

I did incorporate two two-way rides of the mid-course hill, which is not steep, having an elevation change of 33 feet over its 1.08 km length. The two rides agreed just fine, just as Neville’s did. Intuition leads me to believe that this indicates that a modest hill in the calibration course has little effect, so long as it is ridden both ways. But intuition is not proof.

Still, even with the ridiculous incline of portion A-B, the error would be well within the SCPF, and it’s likely that more humane inclines would have even less effect.

Anybody wishing the raw data, just say so and I'll send you an excel file to play with.
Mark:
My conclusions at the end of my last post were based on the assumption that the average calibration factor from a flat course, even if it did not correspond exactly with that from a sloping course, at least should fall somewhere between that found for downhill and that found for uphill measurements. However, I notice that your average calibration factor for the more flat course is much higher than either of the latter two from the sloping course. This seemed inconceivable to me so I decided to test my assumption.

I taped a 152.296-m course with a drop of about 10 m and found that the overall average calibration factor from two downhill and uphill rides differed from that found on a flat 400-m course by only plus 0.005%.

I note that in going from your more flat course to your sloping course you went from asphalt to concrete. Mike Sanford has stated that this results in a decrease in calibration factor, and Pete in his recent post indicated that his experience shows this decrease to be 0.06%. Your results show a closely matching decrease of 0.08%. Evidently, the newly discovered “hill” effect is really only the old road-surface effect!


Results from flat 400-m course

1. 191.68
2. 191.71
Ave 191.695 or 479.24 rev/km with no SCPF


Results from 152.296-m course with a drop of 10 m

1. 72.94 (down)
2. 73.04 (up)
3. 72.94 (down)
4. 73.04 (up)
Ave 72.99 or 479.26 rev/km or plus 0.005% from flat course
Pete pointed me to several articles about surface effect, including some by Mike Sandford. But they all seemed to compare roads that had significant differences in roughness, very smooth vs. bumpy. None of them specifically mentioned asphalt vs. concrete. My two surfaces are both quite smooth, even though one is asphalt and one is concrete. Pete didn't mention the relative smoothness of his two courses. Also, Pete's asphalt readings in that temp range vary by 9 counts/km. Seems reasonable to expect that if he had more concrete readings they would vary by a similar amount. So are we looking at two values on the bottom, in the middle, or on the top of that range? I think his data shows that it is very likely his concrete constants are smaller than his asphalt constants, but it's dangerous to try quantify that based on two readings.

But I do plan to repeat my experiment on another road where the surface will be exactly the same for both courses.

There is little doubt that the difference I see in my two courses is real. I ran two separate experiments with 32 blind trials in each, and got almost exactly the same difference between the two courses in each test. The only question in my mind is what is causing this difference. I see several possibilities:

1) Course length - I measured my courses two times on different days using a scale to measure tape tension. The difference in the two measurements was 1cm. I think it is very unlikely my two courses differ in length by more than 2cm (about 1 count/km).

2) Surface effect - even though my two surfaces are about the same smoothness, the friction may be quite different and that could be as important as smoothness.

3) Tire effect - I'm using a mountain bike tire that is relatively low pressure and includes some tread.

4) Hill effect - Neville sees no overall hill effect. Pete sees a small overall hill effect which changed directions in his two experiments. I see a strong overall hill effect.
I see uphills giving a significantly smaller constant than downhill rides on moderate slopes. Pete sees uphill rides giving a significantly smaller constant on steep slopes. Neville sees the opposite on steep slopes.
I'm not sure we have all this hill stuff figured out yet.

5) Combination of one or more of the above. It's possible that the tread on my tire deforms differently depending on the friction of the road surface. It's possible there is a hill effect, but it's quite small, and my tire simply magnifies this effect.

I will have another set of courses that have a similar topology, but the same surface throughout. I also now have a higher pressure road tire. I plan to repeat this experiment with different combinations in order to find out what is causing the difference I'm seeing, so I can avoid that problem in the future.
Variation of my rides of September 7:

The 12 flat rides (C-D and D-C ) had a total span of 3.15 inches, less than a count. This is pretty good riding.

The four downhill rides (B-A) had a span of 7.5 inches, just under two counts.

The four uphill rides (A-B) had a span of 11 inches. Not good, indicating erratic riding. It's hard to maintain straightness on a steep uphill.

On the more modest grade of C to B the agreement was what one would expect from flat riding, and anyone examining the data would have no reason to suspect any hill was present.
I was not able to do any tests last weekend because there was an art festival in the park near our neighborhood and our streets were all nuts, even early in the morning.

This weekend I was able to move over to the next street beside mine to repeat the hill experiment on a street where the hill calibration course and flat calibration course had identical road surfaces. The courses were 180m long and the hilly course had about a 4m change in elevation. I conducted the experiment in the same way as the previous ones, with a total of 16 flat and 16 hill rides.


Again I get the average cal constant of uphill and downhill rides to be smaller than the average of the flat rides, although it is only 6 counts/km in this experiment compared to 10 in the previous two experiments. This change in magnitude may be due to the different surfaces on the hilly and flat courses in the previous tests.

Not sure why the flat out ride average was higher than the flat return ride average, but still, both flat ride averages were higher than both uphill and downhill averages.

After 3 separate experiments with a total of 96 rides, I have come to the conclusion that for ME riding MY bike, there is a hill effect. That effect is that averaging uphill and downhill rides on a hilly cal course will give me a lower cal constant that averaging rides on a flat cal course. This may not be true for others.

However, I do believe that for everyone it is a mistake to use a flat cal course when the race course is hilly. In this case, if there is a difference between flat and hilly cal courses, then it makes sense to use a hilly one. If there is no difference between flat and hilly cal courses, then using a hilly one won't hurt you.
Gotta weigh-in.

I think Pete summarized it perfectly in his 9 Sep. post - "It's hard to maintain straightness on a steep hill."

Guys, if you put a 3"-wide painted line along any calibration course, I would venture to bet that none of us can stay on that line the entire 1000 - 2000 feet. The wobble in our ride impacts your counts by 1-3 clicks on each course. I notice this when I ride in the wind, or am just feeling my age. Wobble is there on every ride.

When we get old enough to need training wheels to ride a sufficiently-straight line, we need to hang up our JO. Until then, I intend to accept that my calibrations may yield a difference of up to 5 clicks per mile, and accept a variance of 18" per mile.

I have always had 2 clicks more on my uphill cal rides than my downhill (solid tires, not pneumatic). I expect it. And, if I don't have that variation, I know one of my rides had too much wobble, likely on the uphill rides.

Just my ramblings while the Indians beat the Sox. GO ROCKIES!

Add Reply

Post
×
×
×
×
Link copied to your clipboard.
×