
On my last measurement I had a slow leak and decided to replace my tires.

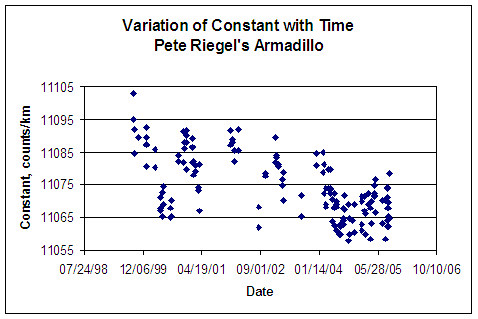
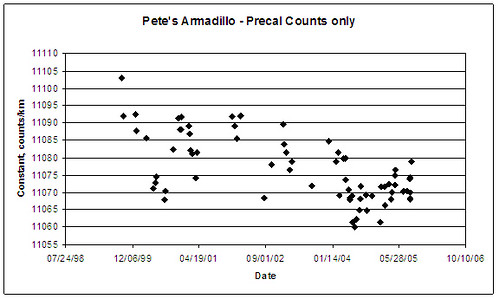
Here is a complete history of my former pneumatic tire. All calibrations are shown, both precals and postcals. I've started a new series with new tires, but thus far have only two calibrations.

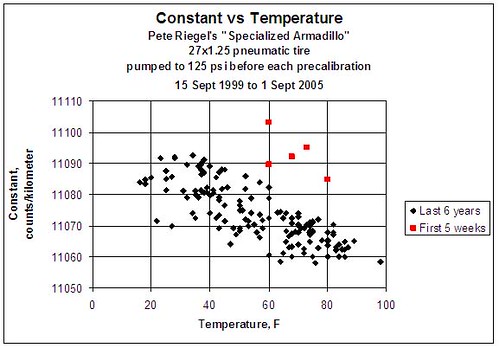
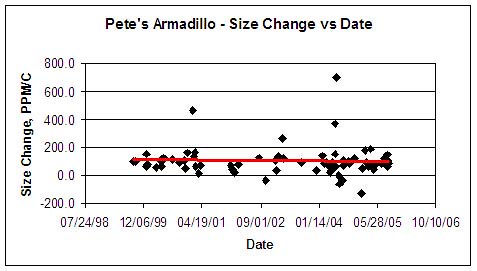
Note: the first five calibrations took place just after installation. I think the tire, under its newfound inflation stress, spent time creeping into its equilibrium size during the first few weeks.

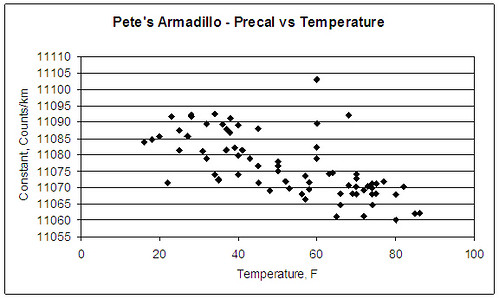
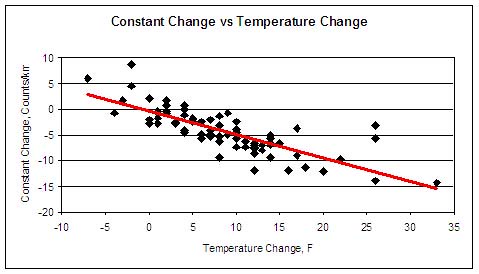
I remain puzzled as to why the tire size should have gotten larger as temperature increased. After all, the initial pump-up pressure was constant throughout. I had thought that rim expansion might explain it, but the expansion, while in the right direction, was not nearly enough to explain it.

Last edited {1}
Original Post

Replies sorted oldest to newest

Pete:
I should think that your postcals in general were done at higher temperatures than your precals. Hence tire pressure would be higher and the constant lower. If you remove the postcals from your plot, you may find the temperature dependence disappears.

Also, if you were to fit a pressure gauge to your valve stem for your measurements and adjust for changing pressure,your constant would be indeed constant.
Pete:
Its clear from your last two plots that the cirumference of the tire increased with age.
However, my suggestion was that you plot the precalibration constants not against date but against temperature. This might show that at constant pressure there is no temperature effect as seen in your very first plot.
quote:
Originally posted by Dave Poppers:
It occurs to me that as the tire wears, it loses the structural resistance to longitudinal (is that right?) expansion at a constant pressure.


This is common with fabric-belted tires. Imagine a strip of duct tape. By itself it's quite flexible. Add another three or four layers to simulate tread and you have approximated a bicycle tire's rigidity. Try stretching four layers; I'll bet you can't. Now "wear away" the tread by removing layers one at a time and you can observe the effect yourself.

Note that this is an imperfect experiment, as the tread layers of a tire do not contain fabric. However, the integrity of the rubber itself is sufficient to reinforce the fabric at bicycle speeds.

Another variable in the wear-vs.-temperature equation is the tire's mass. As the tire wears, its mass decreases, and as that mass decreases its capacity to store heat does the same. As this capacity is reduced, the effect of a constant temperature is greater.

For instance, imagine two coins in the sun, both nickels. One nickel has been in my pocket for 15 years and has lost 10% of its mass due to wear. The other is newly minted. Both coins sit in the sun for 15 minutes (both coins are made to absorb the same amount of heat energy). The old coin's temperature will be greater than the new. Its thermal expansion will therefore be greater.

In theory.
The coefficient of thermal expansion is much higher for rubber as well. I'm can't quote a reference, but I think it's about 7 X10⁻⁴/degree C, pretty large compared with aluminum or steel., I think they are about 2.5X10⁻⁵ and 1.9x10⁻⁵ respectively.

The expansion of the rim will be a complicated thing to compute as well. The aluminum rim will try to expand at a fater rate than the steel spokes, increasing the tension in the spokes and inducing compression in the rim.

Figuring out the how the whole assembly expands and contracts will be a tricky bit to do. The bead of the tire will be held to the rim, and the shape of the tire would distort a bit as temperature increases. I think the distance from the outermost limit of the tire to the rim will increase with temperature, but I'm not sure.

I'm pretty sure the elastic properties of the rubber increase with temperature as well, although this would be small compared to the changes in diameter. Pressure accounts for 99% of the support, but you can wheel a bike around on a flat, so the tire itself contributes a little.

Good data, and a remarkable puzzle.
Before each precalibration the front tire was pumped to 125 psi and the rear to 75 psi. No tire pressures were taken during the rest of the measurement process, as a variable bit of air always escapes when the gauge is applied.

Once precalibration begins, it's standard practice to not meddle with the tire valve in any way.
We have seen that the size of the tire has been gradually increasing over the six years of data-taking. What about its measurement behavior?

Years ago Mike Sandford came up with a way to express calibration change as a function of temperature change. Here is an example:

On August 17, 2003:
Precal constant was 11071.29 counts per km at 7:30 AM at 77F
Postcal constant was 11065.22 counts per km at 10:15 AM at 89 F
Change of constant was -6.67 counts/km. This indicates that the tire increased in size.
Temperature change was 12F = 6.7C
Size change as a decimal fraction was: 6.67/11065.22 = .000603
Size change expressed in parts per million was:
1,000,000x(.000603)= 603 ppm
Constant change expressed in ppm/C was: 603/6.7 = 90.4

This change was plotted for every pair of precal and postcal, and below we see what we got. The red line is the best-linear-fit trend as created by Excel – it merely shows what the eyeball sees. The trend is unchanging with time.

It is seen that although the size of the tire changed with time, its behavior as a measuring tool did not. It responded in a similar manner to temperature changes throughout the testing period. As temperature increased, so did tire size.

The previous post may be more complicated than necessary. We have a tire that has a constant of about 11070 counts per kilometer. How much does its size change with temperature? From my previous post we see that it ran at a fairly constant level of about 100 PPM/C for the entire 6 years.

This works out to about 5 counts per kilometer for every 10 degrees F.

If I precalibrate at 11070 counts per kilometer and the temperature rises 10 degrees F, my postcalibration constant will be about 11065 counts per kilometer.

The graph below shows how it actually worked out. My apologies for mixing metric and imperial units. I use a metric constant, but I measure temperature with a Fahrenheit thermometer.

The root cause of the tire growth is the breakdown of the rubber over time. The rubber serves as a binding agent between the fibers of the fabric to prevent its stretching as in the duct tape model. Temperature and the flexing that comes with use break down the rubber. Ozone also has an effect. Examine the sidewall of the tire, and see if it exhibits cracks in the carcass; these are due to ozone attacking the rubber. Sunlight exacerbates the problem.

Also, as less rubber is available to restrict the fabric, the pressure within the tire can stretch the fabric more, for a given pressure. This alone could account for the observed growth.

While measureable, I'm inclined to write off a growth of 603ppm over 8 years (75ppm/year)as statistically insignificant. The rider sneezing during a race measurement is likely to have a greater effect on a course measurement.

Still an interesting technical exercise.

Add Reply

Post
×
×
×
×
Link copied to your clipboard.
×