Years ago Mike Sandford came up with a way to express calibration change as a function of temperature change. Here is an example:
On August 17, 2003:
Precal constant was 11071.29 counts per km at 7:30 AM at 77F
Postcal constant was 11065.22 counts per km at 10:15 AM at 89 F
Change of constant was -6.67 counts/km. This indicates that the tire increased in size.
Temperature change was 12F = 6.7C
Size change as a decimal fraction was: 6.67/11065.22 = .000603
Size change expressed in parts per million was:
1,000,000x(.000603)= 603 ppm
Constant change expressed in ppm/C was: 603/6.7 = 90.4
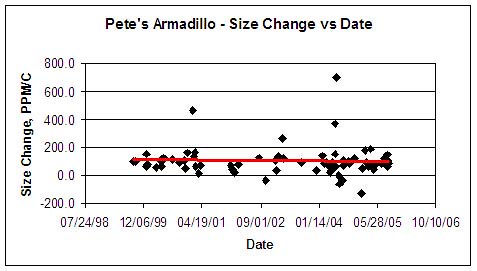
This change was plotted for every pair of precal and postcal, and below we see what we got. The red line is the best-linear-fit trend as created by Excel – it merely shows what the eyeball sees. The trend is unchanging with time.
It is seen that although the size of the tire changed with time, its behavior as a measuring tool did not. It responded in a similar manner to temperature changes throughout the testing period. As temperature increased, so did tire size.