What is the current understanding of how elevation data can be used to assess course difficulty? I recall that someone suggested a formula for this, but it was quite some time ago.

I am asking about this because I got talked into participating on a panel with the aim of ranking or comparing local courses for the purpose of assisting in area runner rankings.

This is against my better judgement; I told them the best way is to collect enough results so that you could compare times achieved by the same runners on the various courses. But since I don't yet have that information I would like to know if there is a valid (or possibly valid!) way to use elevation data to do this.
Original Post

Replies sorted oldest to newest

I don't really know what's been done recently, but I'll remind you of the work we did some 24 years ago, which we applied to the Boston Marathon course.

To a first approximation, the effect of elevation is given simply by the elevation difference between a course's start and finish. Ken Young realized this a long time ago, and it's why we base the aidedness of a course for record purposes on its net drop. In an attempt to go beyond this first order approximation, I presented a formula for "Hill Effect to Second Order" which was published in the January 1989 issue of Measurement News, available at http://www.runscore.com/course...mentNews/033_89a.pdf

A year later, Alan Jones and I applied this to the Boston Marathon course in an article titled "Uphills, Downhills and the Boston Marathon" published in the March 1990 issue of MN, available at http://www.runscore.com/course...mentNews/040_90a.pdf This article also included a derivation of the 2nd order hill formula, which I hadn't included in my 1989 article. And in that same March 1990 issue, Pete Riegel used the formula to work out optimal pacing for the Boston Marathon course. Pete and I also applied the formula to a number of other courses around that time.

My 2nd order formula was based on the assumption that the energy cost of running, per unit distance, is a nearly linear (but slightly convex) function of slope -- an assumption that seemed to be borne out fairly well by energy cost measurements on treadmills, for the range of speeds used in distance running. It was also based on a simplified physiological model, assuming that the runner has a fixed energy store, which can be used maximally by expending energy at a constant rate. Clearly, this ignored a lot of effects (such as physiological changes in a given runner during the course of a race). But, overall, it seemed pretty reasonable.
Bob,
What would be the best way to collect the necessary information to calculate the steepness integral? In your discussion you described using a paper edge to locate each point where the course crosses a contour line-- can a course profile such as that produced on MapMyRun provide this information? And what about using Gmaps-pedometer with the contours displayed to get the distance to each contour line? Or maybe there is a better way that someone can suggest.
Bob,

Our methods were pretty primitive at the time. I suppose you could try to duplicate what I did in 1989 by using Gmap-pedometer, but that would be awfully laborious. Given current mapping tools, it shouldn't be necessary to interpret contour lines on old-fashioned topo maps.

MapMyRun has various idiosyncrasies. It produces a nice elevation profile, which appears to be fairy accurate, using its Full Screen map view. But I don't know any way to export the data from that profile. You CAN export the data when you're NOT in Full Screen mode by using its "Download Data" link, which produces a CSV file that you can import into a spreadsheet. The elevations obtained that way don't seem to be as accurate, but maybe they're good enough to estimate the steepness integral. One catch is that "Download Data" may provide only a sparse set of points along the course. To work around that problem, you need to generate the course using a dense set of points (maybe every 100 meters or so). Also, data points in the CSV file appear to be duplicated, so you'll need to account for that in your spreadsheet.

While the elevations obtained using MapMyRun's "Download Data" might be used for estimating the steepness integral, they aren't accurate enough for determining Start and Finish elevations (you might obtain those with Google Earth, unless extreme accuracy is needed, in which case USGS sources should be used).

Another note about MapMyRun. To obtain reasonably accurate distances, it's necessary to turn off its "Auto Follow Roads" feature and use a more manual approach to pick points along the SPR. I've included this tip in our website, see http://www.usatf.org/Products-...nal-Tools.aspx#gmaps
Last edited by bobbaumel
I experimented with the method described in my previous post by trying it for the Pioneer Woman 10 km course in Ponca City, same course used as an example in my 1989 article, where I estimated the elevation profile manually from a paper topo map. My conclusion: MapMyRun's "Download Data" feature should be avoided totally. In this case, I generated the course in MapMyRun using a dense set of points as described above. Here is a plot of the data exported using the "Download Data" feature:

Notice all the jitter in this plot. The steepness integral computed from this profile is 8.06 m, whereas I originally obtained 6.1 m in 1989. Meanwhile, MapMyRun displays a very nice (apparently quite accurate) profile in its "Full Screen" mode. I don't know how to export this data automatically, but if you hover your mouse over it, it shows underlying data as in the following screenshot:

My suggestion: work your mouse along the plot and write down all the data. You may need to copy about 100 data points. It takes some manual effort, but surely a lot less work than when we were using paper topo maps back around 1989 and 1990.

Also note: if you're using the profile inside MapMyRun's Full Screen mode, there's no need to use a dense set of points when generating the course. Use only as many points as needed to define the course. (As I wrote previously, always turn off "Auto Follow Roads" in MapMyRun, and select points manually to follow the SPR.)
You can show the elevation profile in google earth as well, and just like Mapmyrun, there doesn't seem to be any way to output the data that is used to generate this profile.
But it gives some pretty useful summary statistics that could be used to calculate an effective lengthening of the course. In particular it gives the total climbed meters, which I think is proportional to the (dy/dx)^2 term.
Mark,

Thanks for pointing out that Google Earth can also do elevation profiles. Here it is for the same course as displayed above:

This is probably the most accurate and detailed profile yet. It also displays local elevations when you hover your mouse over the plot (and, in addition to displaying elevation, it also shows the slope at the indicated point). As you say, there doesn't seem to be any way to export the data.

But, no, total climbed meters isn't proportional to a (dy/dx)^2 term. Google Earth does display total climb (sum of all uphill elevation changes), total descent (sum of downhill elevation changes), maximum uphill and downhill slopes, and average uphill and downhill slopes. None of these can be used to compute the steepness integral, which is the mean squared slope multiplied by course length. The mean squared slope is the square of the RMS (root mean square) slope value.

For this particular course, the average uphill and downhill slopes are 2.1% and -2.1%. It's an interesting coincidence that these have the same magnitude, but this isn't true in general, even when start and finish elevations are equal. Since they do have the same magnitude, it's easy to see that the average absolute value of slope is 2.1%. However, this isn't the same as the RMS slope, which we'd need for finding the steepness integral.

Assuming that the steepness integral of 6.1 m that I computed in 1989 is correct for this course, we can work backwards to find that the mean squared slope must be 6.1/10000 = 0.00061 and, therefore, the RMS slope is sqrt(0.00061) = 0.0247 = 2.47%.
A note on my previous post that included an elevation profile from Google Earth: I wrote, "This is probably the most accurate and detailed profile yet." It's certainly detailed, but I realize that it includes some artifacts. For example, notice the steep, narrow dips at around 0.22 km and 1.48 km. These are places where a creek or drainage ditch passes under the street. The street includes a bridge or other built-up structure so it remains level. But Google Earth determines elevations by mathematically fitting the general shape of the earth's surface, ignoring built-up structures like bridges. So it displays a profile as if runners ran right into the creek or ditch!

These artifacts may impact some of the statistics displayed with Google's profile, such as Elevation Gain/Loss and Max Slopes.

The elevations in MapMyRun are ultimately derived from the same Google database, but they aren't as fine-grained, so aren't as sensitive to these artifacts. My preferred method for deriving the steepness integral is still to display the profile in MapMyRun (Full Screen view). Hover over the plot and copy all the data points. Then enter in a spreadsheet to compute the steepness integral.

As an interesting observation: While Google Earth seems to totally ignore the built-up structures that maintain levelness of streets and roads, I think the contour lines on old-fashioned topo maps may have done a better job of accounting for such features.

The fact that Google Earth's elevations don't include bridges may also be an issue in deriving elevation profiles for courses with significant portions on bridges, such as the New York Marathon, which crosses the Verrazano Bridge at its start.
I too have been frustrated by GE's feature of ignoring human artifacts. Once in a while I've been able to dig up survey results that show bridge elevation. Sometimes I've been able to use data from a gps device-- probably best not to use it by itself but relative to readings obtained where an elevation is otherwise known.

Bob can you help out with this concept, I think I have the same question as Matthew. Are you saying that steepness going downhill has the same effect on "effective course length" as steepness going uphill?
Okay, I will try to explain. My 1990 MN article at http://www.runscore.com/course...mentNews/040_90a.pdf included a derivation of the 2nd order formula in its Appendix, so I will not repeat that derivation here. But I'll try to explain why uphill and downhill grades both increase the effective length of a course.

In my 1990 article, my reference for energy cost of running was the classic paper "Energy cost of running" by Margaria et al, published in Journal of Applied Physiology in 1963. That article is available online at http://jap.physiology.org/content/18/2/367 Given that it's 51 years old, I was hoping it might be available for free. However, only its Abstract is available for free, and you'd have to pay to read the full paper. The abstract includes the key sentence: "Within these limits, the net kilocalories per kilogram per kilometer values seem to be independent of speed and related only to the incline." Thus, even though energy cost per unit time is obviously greater when running faster, the energy cost per unit distance is independent of speed and depends only on the incline.

As for the actual functional dependence of Energy/distance on slope, I re-plotted some of Margaria's data in my 1990 paper. Here is a more schematic version of that plot, with the vertical scale exaggerated to emphasize the curvature:
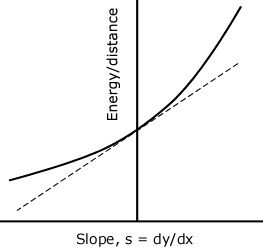


Here, the curved line represents actual energy cost, while the dashed straight line is the tangent to the curve, drawn at slope = zero.

To the extent that the energy cost can be approximated by the straight tangent line, the effective length would be given by:

L + A*(Hf - Hs)

where L is the course length, A is some coefficient, and Hf and Hs are the finish and start elevations.

But the actual energy cost is given by the curved line. And for both positive and negative slopes, the curved line is above the straight line. We can approximate the curved line as a parabola, in which case the difference between curved and straight lines is proportional to the square of slope. With this parabolic approximation, the formula for effective length is extended to:

L + A*(Hf - Hs) + B*SI

where B is another coefficient and SI is the steepness integral, defined as the integral of squared slope along the course.
Hills and Running Speed

According to our ancient figurings a hilly course should produce a slower time. My personal data shows the opposite.

When I was a baby marathoner, age 39, I was attracted to the Athens Marathon in Athens, Ohio. It was almost all on rural roads and was quite scenic. It became my favorite marathon. My first experience there was disappointing, because I was shooting for a sub-3:30, which would get me into the Boston Marathon. I ran a 3:35, but had been on an 8 minutes per mile pace until late in the race. I got out my topo maps and dividers and discovered that the course was about 1.5 miles too long. Based on this Boston let me in.

In those early days few courses were certified, but the running was fun. I especially liked running with the small fields that were common before road racing really took off.
My personal marathons are shown below, along with data on the Athens course, showing its four large hills.

By my reckoning, I ran 7 minutes faster on the hilly Athens course, on the average, than I did on my other marathons, all of which were less hilly.

I offer no explanation for the above.


Last edited by peteriegel
The stars are back in proper alignment.

The top 5 Athens times average 11140 seconds.
The top 5 others average 11005 seconds.
Flatter courses are faster by 2.25 minutes

The best Athens is 10753 seconds.
The best other is 10602 seconds.
Flatter course is faster by 2.52 minutes

The reason is that the distribution of running times is one-sided. Try as you may you cannot beat your best by much, but it is easy to have a bad day and get a woeful performance, as I did on many occasions.

I don't know why I should be happy to see myself back in alignment with perceived reality, but I am.
Last edited by peteriegel
John Sissala used to include a "slope" or difficulty rating to every race in the Montgomery County Road Runners Club annual race schedule. He rated courses from 1 to 10, with 10 the hilliest. This was John's intuitive rating, based on his experience both measuring and running these courses. I always agreed with his ratings, and I remember that no one ever questioned them. I always felt this was a good help in setting my expectations about how to run new courses.

Bob (Thurston) - with all your experience, I am willing to bet your intuition would serve well for any course you have run or measured that you remember well. If you start of with a couple of benchmarks that are easy for everyone to agree on, I can guess you would come up with a highly reliable system that requires little or no number crunching.

For example, a track race = 1, and Pike's Peek Marathon = 10. Then, estimate what a 5 and a 6 might be from known courses. Interpolate in both directions and start to fill in courses in all ratings. Use .5s if you have to. Then, compare net altitude changes by looking at Google Earth maps of a few courses (I realize this is where some work comes in). Use these elevation profiles as a check and adjust your benchmark courses at all 10 levels. My thinking is that it then becomes relatively easy to evaluate the difficulty of all subsequent courses by using these benchmarks.

This is where I think intuition can serve better than math unless the math is highly sophisticated, and unless you are willing to do GE elevation profile for every single course being rated. Consider the example of a 10K with only 5 hills, but 3 of them are somewhat steep but not long, one is long but not too steep, and one hill is massive - long and steep. Now, compare this course with a 10K that has a few dozen ups and downs that are neither steep nor long. Both courses measure nearly the same net elevation change, yet the one with fewer but steeper, longer hills would be expected to produce slower times on the average, right? I think your educated guesswork might be all you need to produce a good rating system.
Mark, I agree. But I also disagree-- if this gets too objective, what happens to all those heated arguments comparing course difficulty? And to take that a step further, I recall a long tradition of arguing about the length of various courses. We had one race that we called the "Fort Dupont Mystery Distance Race". I guess someone could have measured it but that would have spoiled the fun.

Actual measurement can also burst many a bubble. I was really proud of my performance at the Springbank 12 Mile Road Race one year. I finished something like 12th place, but I figured out that everyone ahead of me had run at the Olympics so I laid claim to being the first mortal finisher. And I had made a tremendous breakthrough in pace. Until I found out from Bob Baumel that the Springbank 12 Mile was something like 9.8 miles long!

Seriously I have come to be pretty skeptical about "common wisdom" as to course difficulty. I'm inclined to give a little more credence to folks who actually run lots of races. But I'm also curious to see what results we get from course profile analysis.
Mark: I know what you are saying. I am confining my remarks to estimates of difficulty by people who are experienced runners and who are measurers, too. Again, I think any "objective" methodology would have to be more sophisticated than just net altitude change.

I am willing to bet that if you or Bob of most any of us on this forum were to rate the difficulty of courses we have run on, using benchmarks for 1.0 and 10.0, with all courses falling somewhere in between, there would be very little disagreement among folks who run the course.

To test me on this, consider the elevation profiles of 2 different courses that you have run. These will be courses of the same length that have close to the same net elevation change. If one of them has a lot of small hills, and the other has a just a few hills that are large, I will bet that most runners will find the course with the larger hills slower. Therefore, the larger hill course will deserve a higher difficulty rating.

Add Reply

Post
×
×
×
×
Link copied to your clipboard.
×