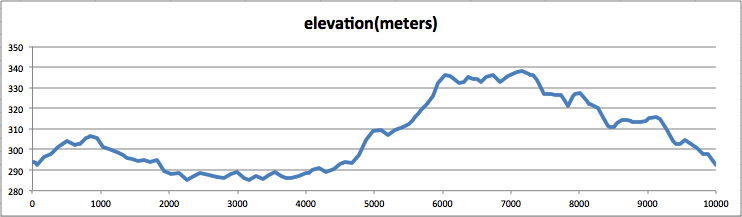
Notice all the jitter in this plot. The steepness integral computed from this profile is 8.06 m, whereas I originally obtained 6.1 m in 1989. Meanwhile, MapMyRun displays a very nice (apparently quite accurate) profile in its "Full Screen" mode. I don't know how to export this data automatically, but if you hover your mouse over it, it shows underlying data as in the following screenshot:
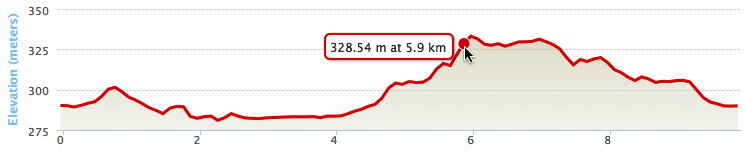
My suggestion: work your mouse along the plot and write down all the data. You may need to copy about 100 data points. It takes some manual effort, but surely a lot less work than when we were using paper topo maps back around 1989 and 1990.
Also note: if you're using the profile inside MapMyRun's Full Screen mode, there's no need to use a dense set of points when generating the course. Use only as many points as needed to define the course. (As I wrote previously, always turn off "Auto Follow Roads" in MapMyRun, and select points manually to follow the SPR.)